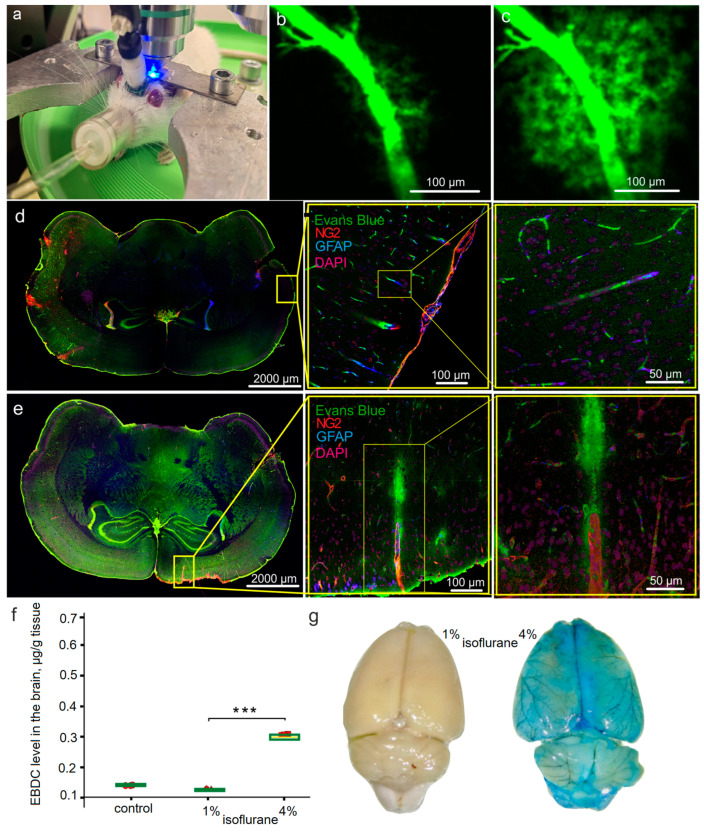
Figure 3.
The effects of different doses of isoflurane on BBB permeability to EBDC: (a) photo of a real-time confocal microscopy of BBB integrity under EEG control in anesthetized rat; (b,c) representative images of the cerebral vessels with intact (IBBB) in rats treated with 1% isoflurane and OBBB in rats treated with 4% isoflurane; (d,e) representative images of whole-brain slices with high resolution of the region of interest illustrating IBBB (d) and OBBB for EBAC (e); (f) quantitative analysis of the EBAC level in the brain of rats from the control group without anesthesia and from the groups treated with 1% and 4% isoflurane, the Mann–Whitney–Wilcoxon test, n = 7 in each group, ***—p < 0.001; (g) photos illustrating typical white color of the brain of rats treated with 1% isoflurane (IBBB) and blue color of the brain of rats treated with 4% isoflurane (significant OBBB for EBAC).

