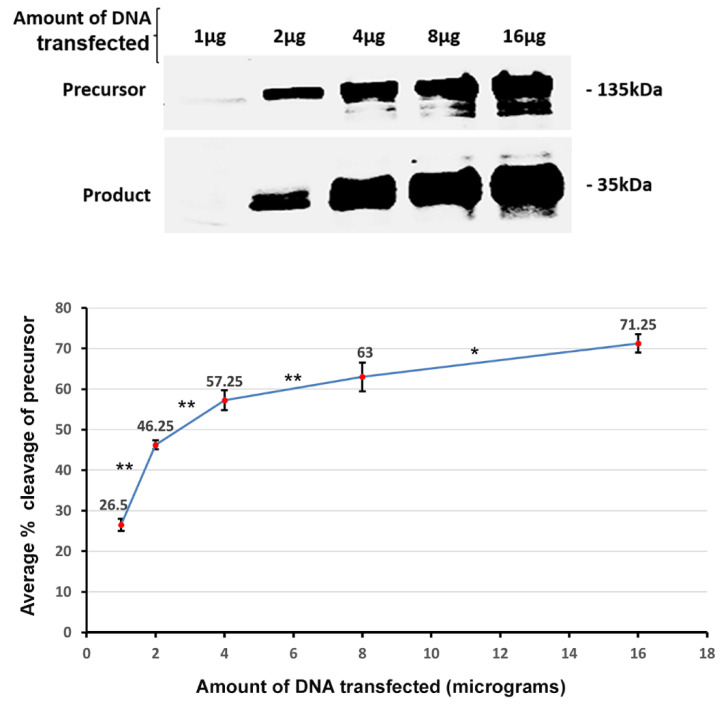
Figure 4.
Effect of substrate concentration on cleavage efficiency. Top, immunoblot analysis of CLCA2-Flag cleavage from lysates of HEK293T cells transfected with increasing amounts of DNA. Bottom, graph relating percent cleavage to quantity of DNA transfected. Percent cleavage was obtained by dividing the signal for product by the sum of signals for product and precursor. Experiment was repeated four times; * p-value < 0.05; ** p-value < 0.005. Blot, anti-Flag.

