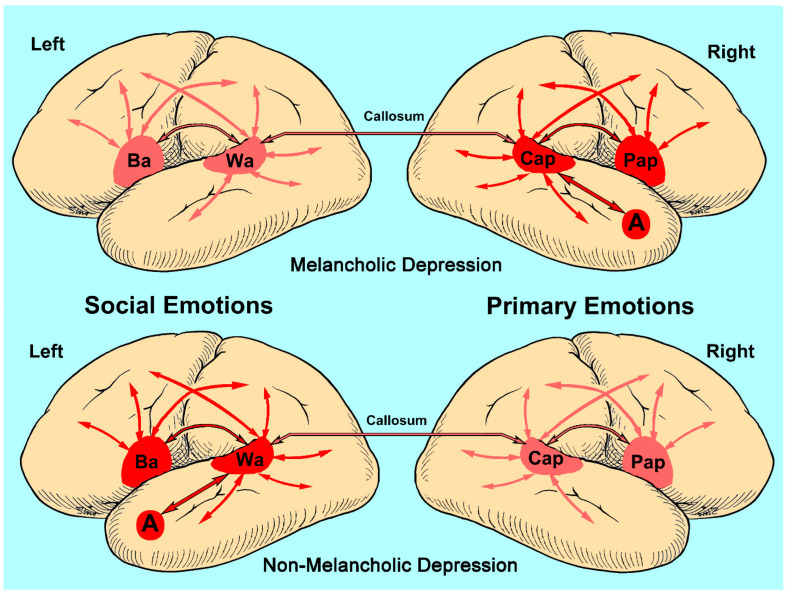
Figure 3.
Simplified drawing to illustrate the neurology underlying melancholic and non-melancholic depressions based on the concept that primary emotions and related display behaviors are a lateralized function of the right hemisphere, and social emotions and related display behaviors are a lateralized function of the left hemisphere (A = amygdala, Ba = Broca’s area, Cap = comprehension affective prosody, Pap = production affective prosody, Wa = Wernicke’s area; see text for detailed explanation of the models). The use of bright red indicates the hemisphere that initiates depression and associated display behaviors most likely by the amygdala. The neutral red indicates that the hemisphere is secondarily involved in the depression and the associated display behaviors are less or, perhaps, much less intense than the depressive behaviors generated by the initiating hemisphere. The actual connections amongst areas are complex and not fully illustrated in the diagram (see Figure 1 and Figure 4). For example, each amygdala has extensive parallel distributed connections throughout its own hemisphere, with the densest connections targeting the posterior insula, and also has direct connections to the hypothalamus. In humans and other primates, the temporal limbic structures (amygdala and hippocampal formation) have, at best, meager inter-hemispheric connections (see Figure 4). Also not shown are the extensive intra-hemispheric connections to the pre-frontal and inferior frontal cortices for higher-order cognitive processing of emotions, such as appraisal, that feedback to the temporal limbic region (see Figure 4 and Section 3.2 for details [4]).

