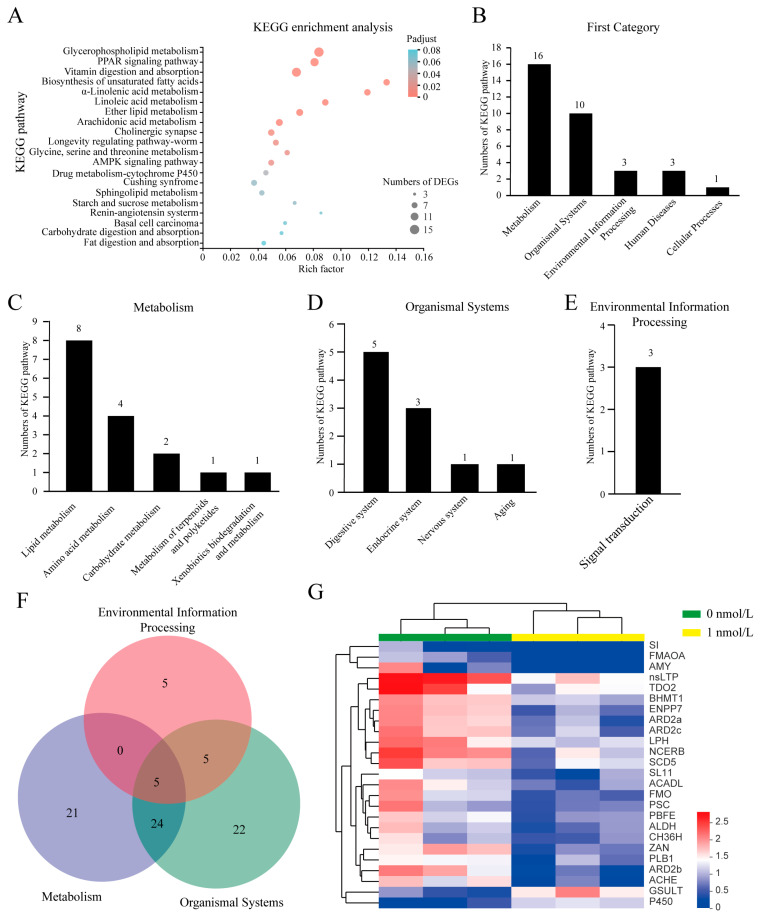
Figure 6.
KEGG pathway enrichment analysis of differentially expressed genes (DEGs) in the regenerated intestine of A. japonicus after TBBPA exposure. (A) KEGG pathways involved in DEGs and the top 20 pathways out of 33 KEGG pathways. (B) The number of KEGG pathways in the first category. The number of KEGG pathways for metabolism (C), organismal systems (D), and environmental information processing (E) in the second category. The number on the column of (B–E) represents the number of KEGG pathways. (F) The number of DEGs involved in metabolism, biological systems, and environmental information processing shown as a Venn diagram. (G) Heat map analysis of DEGs involved in metabolic processes.

