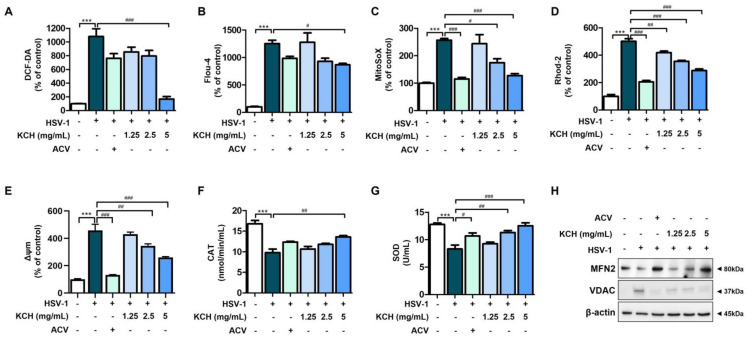
Figure 5.
KCH reduced infection of HSV-1-induced mitochondrial stress in Vero cells. Intracellular ROS and Ca2+ were measured using (A) DCF-DA and (B) Fluo-4AM. Mitochondrial ROS and Ca2+ were determined using the (C) MitoSoX and (D) Rhod-2 staining methods. (E) Mitochondrial membrane potential (MMP, Δψm) was measured using DioC6(3). All fluorescence values were detected by flow cytometry. (F) CAT and (G) SOD activities were measured using an antioxidant enzyme assay kit. (H) The expressions of MFN2 and VDAC were detected via Western blot analysis. Bar graph (mean ± SEM) statistical data were determined using a one-way analysis of variance with Tukey’s post hoc test. *** p < 0.001 compared with the untreated group. ### p < 0.001; ## p < 0.01 and # p < 0.05 compared with the HSV-1-infected group.

