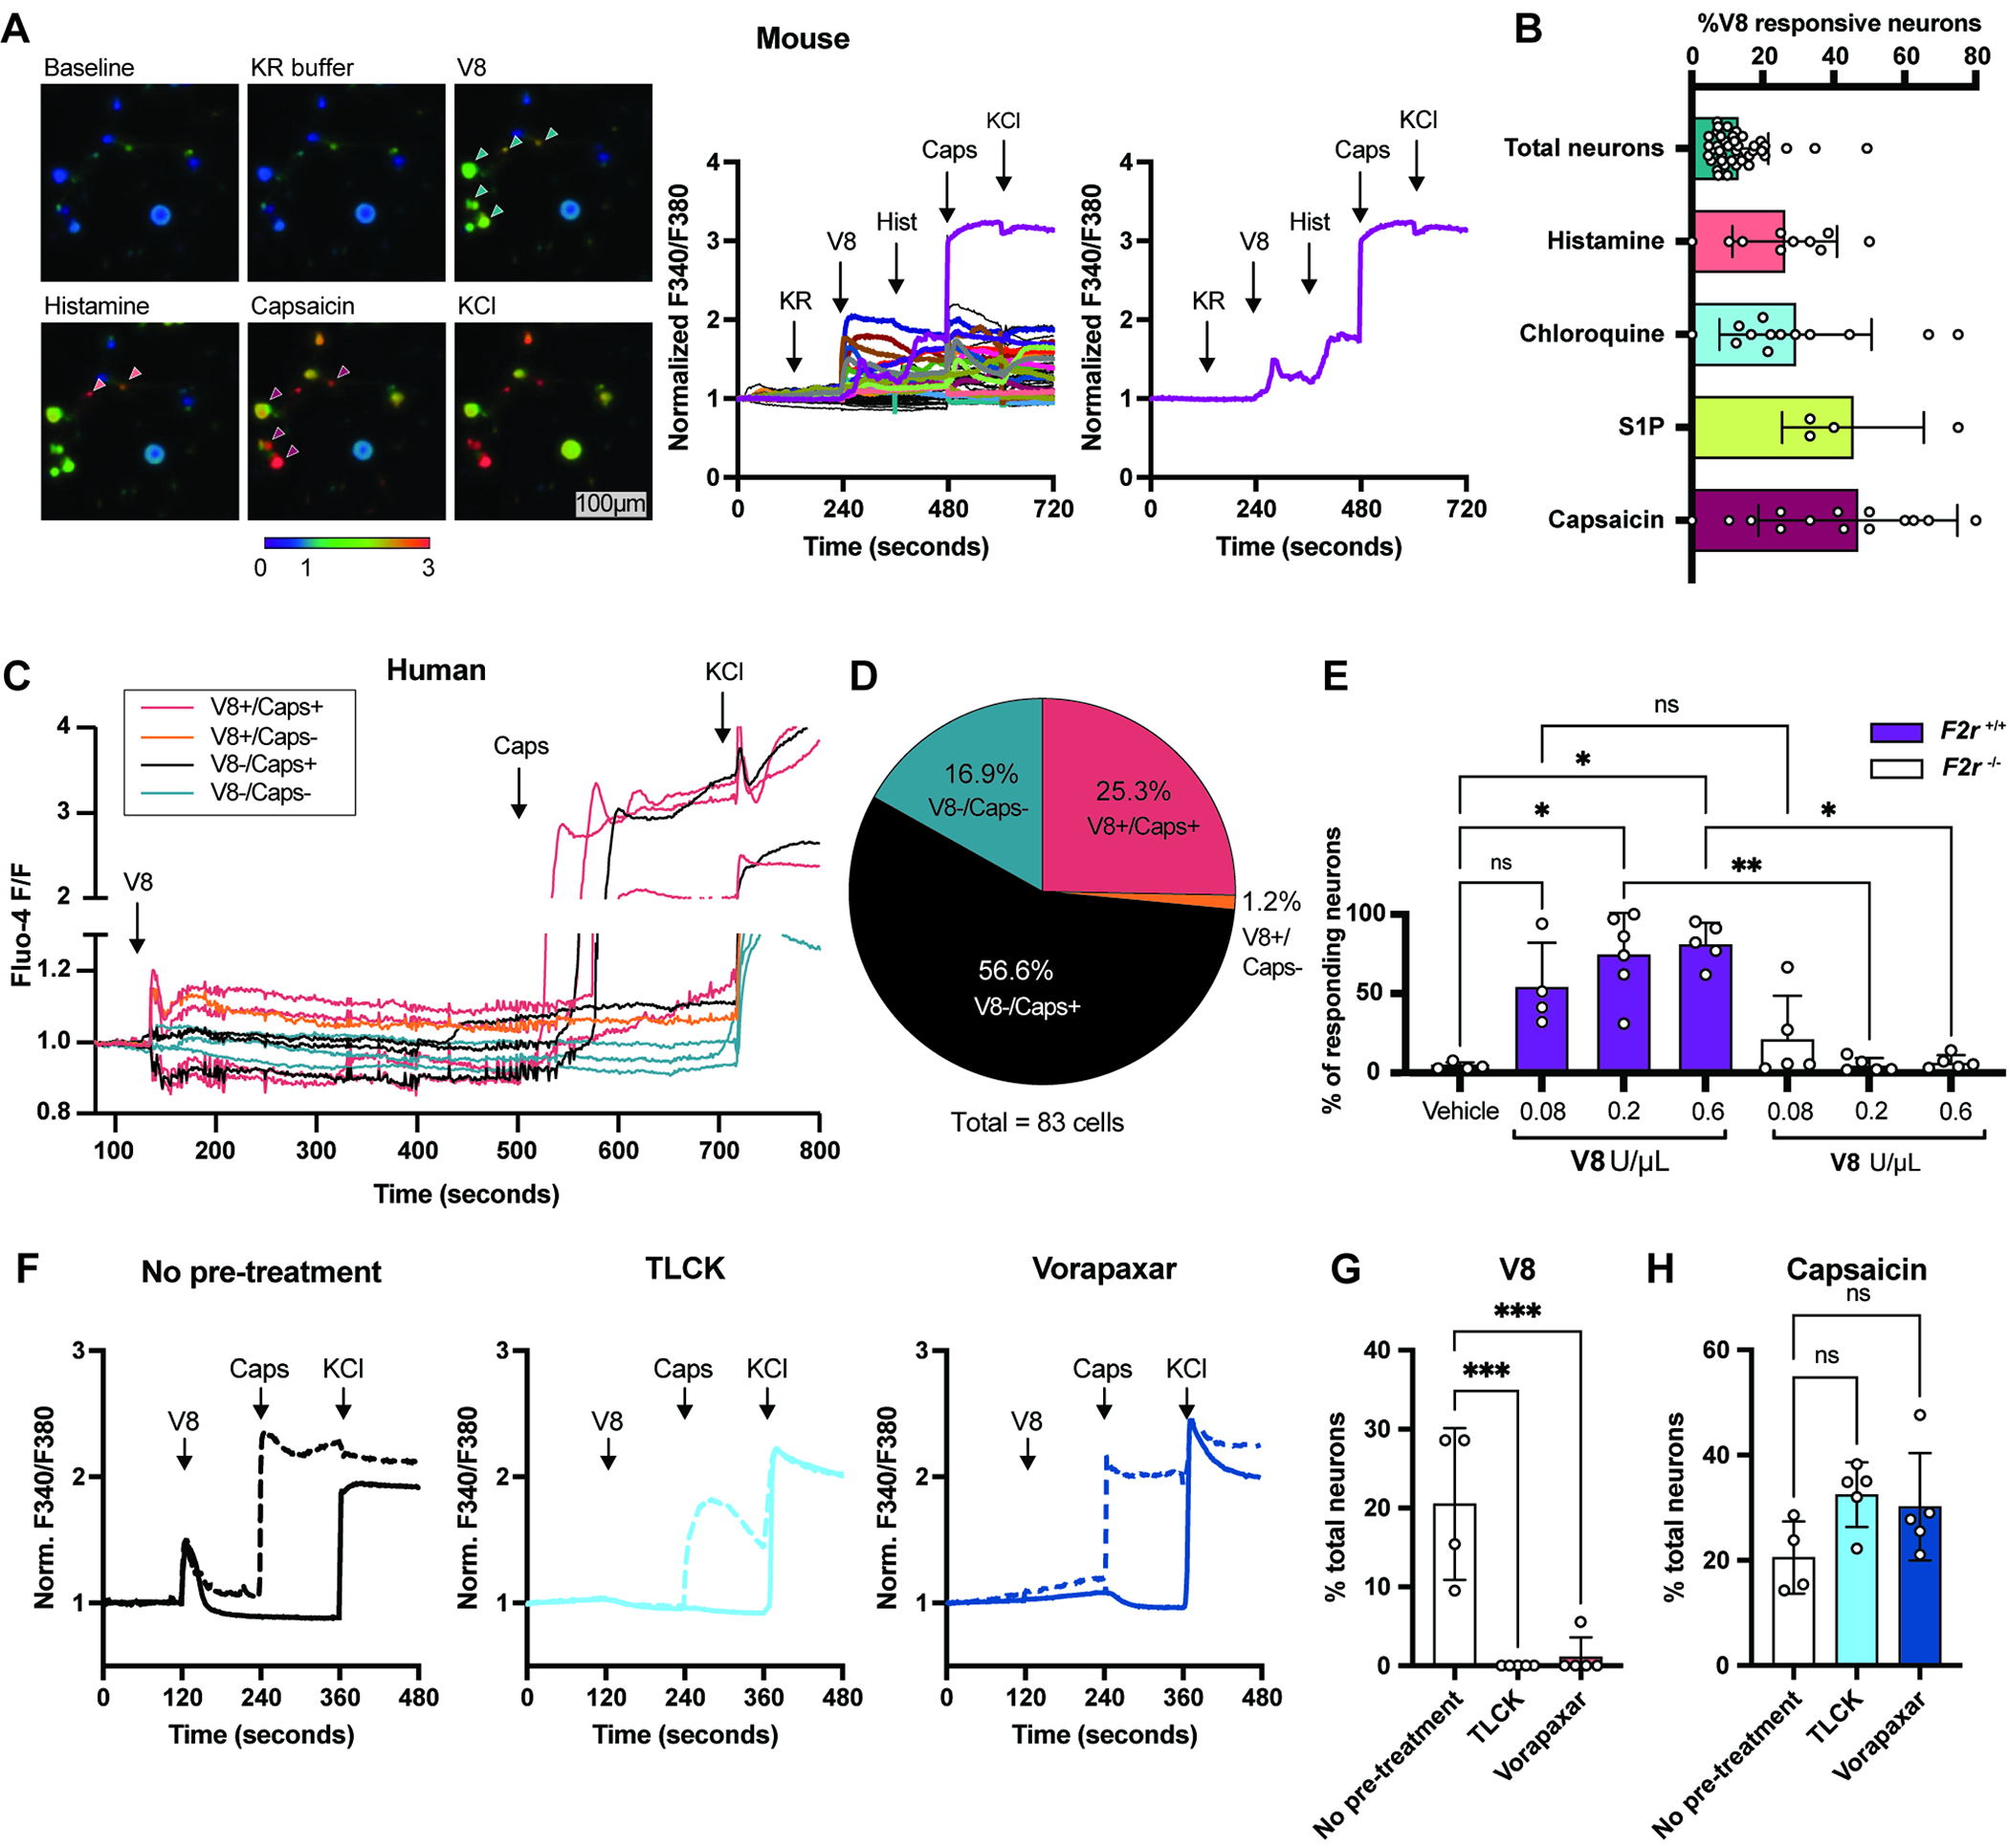
Figure 5. V8 protease directly activates pruriceptor neurons.

(A) Representative Fura-2 ratiometric fields and calcium traces of mouse DRG neurons. Scale, 100μm.
(B) Percentages of total neurons (responsive to KCl) (n=41 fields) histamine-responsive (n= 10 fields) chloroquine-responsive (n=14 fields), S1P-responsive (n=4 fields) and capsaicin-responsive (n=16 fields) neurons that also respond to V8.
(C) Calcium traces of human DRG neurons from a representative dish treated with V8, capsaicin, KCl
(D) Pie chart showing human neuron populations responding to V8 and capsaicin (V8+/Cap+), V8 alone (V8+/Cap−), capsaicin alone (V8−/Cap+), and unresponsive to either (V8−/Cap−)
(E) Calcium imaging analysis of DRG neurons from F2r+/+ and F2r−/− mice treated with increasing doses of V8
(F) Representative calcium traces of DRG neurons treated with V8, capsaicin, KCl with no pre-treatment (left) or 5 min. post-treatment with TLCK (middle) or Vorapaxar (right).
(G-H) Percentage of untreated neurons and neurons pre-treated with TLCK or Vorapaxar responding to V8 (G) or capsaicin (H).
For each panel, data combined from 5 independent experiments are shown. Data are represented as mean±SD.
Statistical analysis: (B, E, G, H) One-way ANOVA. *P<0.05; **P<0.01; ***P<0.001; ns, not significant. See also Figure S7.
