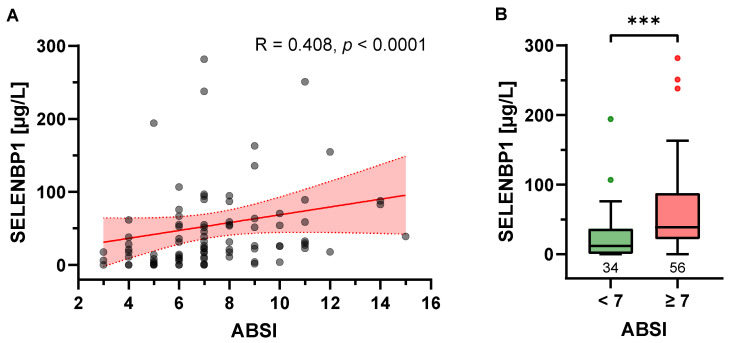
Figure 2.
Correlation of baseline serum SELENBP1 concentration and burn severity. (A) Serum SELENBP1 concentration at baseline and the Abbreviated Burn Severity Index (ABSI) displayed a significant positive correlation, as visualized by a scatter plot and trend line (red) with 95% confidence intervals (red shadow); R: Spearman’s correlation coefficient, two-tailed. (B) When grouped according to their ABSI, burn patients with an ABSI ≥ 7 exhibited significantly higher SELENBP1 on admission than patients with an ABSI < 7 (p = 0.0002). Results are presented as Tukey-style box plots. The numbers below the boxes indicate the number of patients in each group. The Y-axis limit was set at 300 µg/L for optimal visualization; 2 data points exceeding 300 µg/L are missing in the figures ([7, 425.17], [7, 451.68]). *** p < 0.001.

