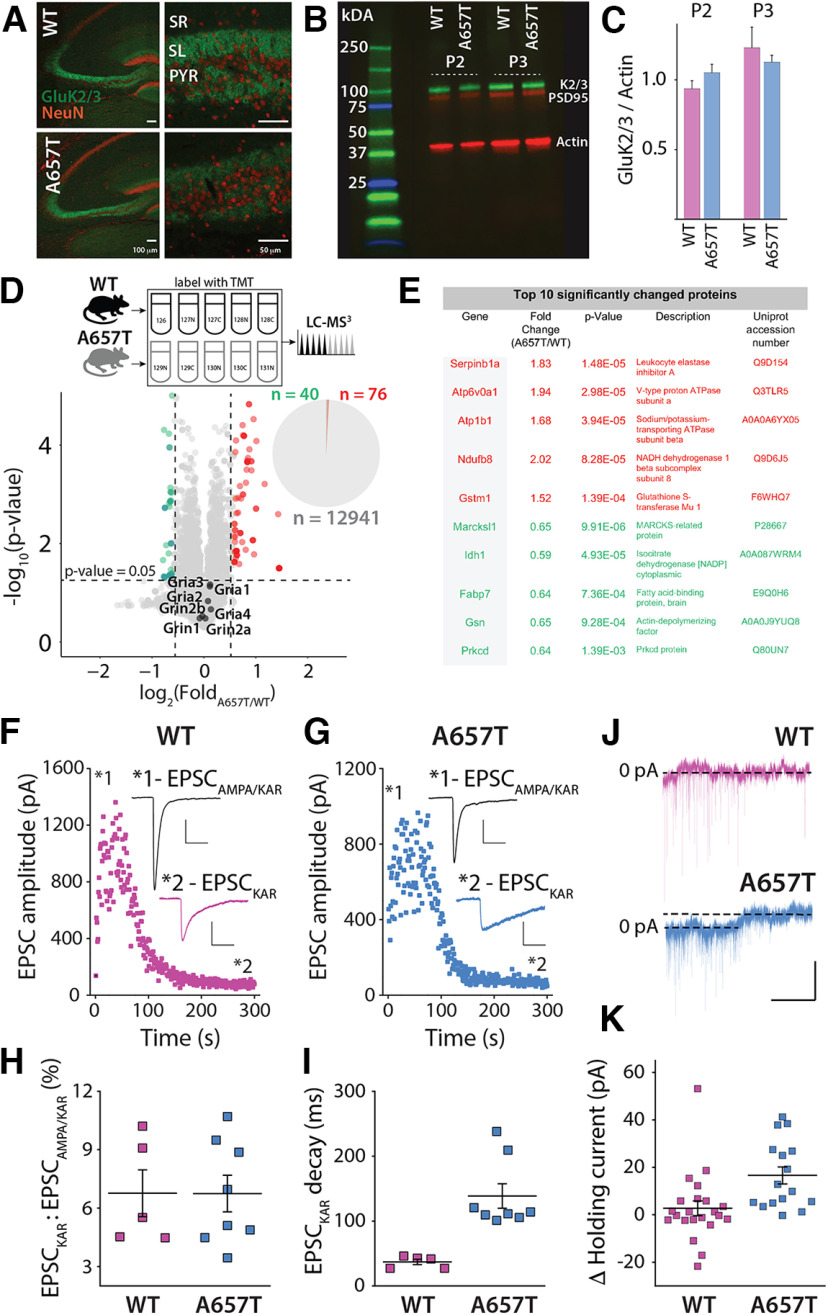
Figure 1.
Aberrant kainate receptor-mediated currents and CA3 proteome in A657T mice. A, Immunohistochemical analysis of KAR expression in the hippocampus. GluK2/3 labeling in the CA3 region was abundant in the termination zones of the MF axons in the stratum lucidum (SL) in both WT and A657T mice. SR, Stratum radiatum; PYR, pyramidal cell layer of CA3. Scale bars: left panels, 100 µm; right panels, 50 µm. B, Representative Western blot of GluK2/3, PSD95, and actin in the P2 and P3 fractions from hippocampus of WT and A657T regions. C, Quantification of Western blots. D, Top, Experimental design to compare WT and A657T CA3 proteomes. Bottom, Volcano plot represents comparison of relative protein abundance in WT and A657T mutant CA3. The major NMDAR and AMPAR protein subunit isoforms are indicated on the plot. Pie chart represents that only ∼0.89% CA3 proteins are differentially expressed in A657T CA3. n = 5 mice per genotype. Significance was assessed using Student's t test. E, Table of top 10 significantly differentially expressed proteins (red represents upregulated; green represents downregulated). Full dataset is available in Extended Data Table 1-1. F, MF EPSCs recorded in CA3 neurons stimulating at 1 Hz to elevate release and measuring EPSCs before and after the application of AMPAR-selective antagonist GYKI-53655 (50 µm) in WT and (G) A657T mice. Inset, EPSCAMPA/KAR prior to antagonist and the residual EPSCKAR (magnified) after AMPAR blockade. Calibration: EPSCAMPA/KAR, 250 pA, 50 ms; EPSCKAR, 50 pA, 50 ms. H, Analysis of EPSC amplitudes normalized to the amplitude of the total MF EPSCs. I, Analysis of the decay of the EPSCKAR. J, Example traces of voltage-clamp recordings from CA3 neurons during application of NBQX (50 µM). Calibration: 50 pA, 60 s. K, Change in holding current of CA3 neurons after NBQX in WT and A657T mice.

