Figure 6.
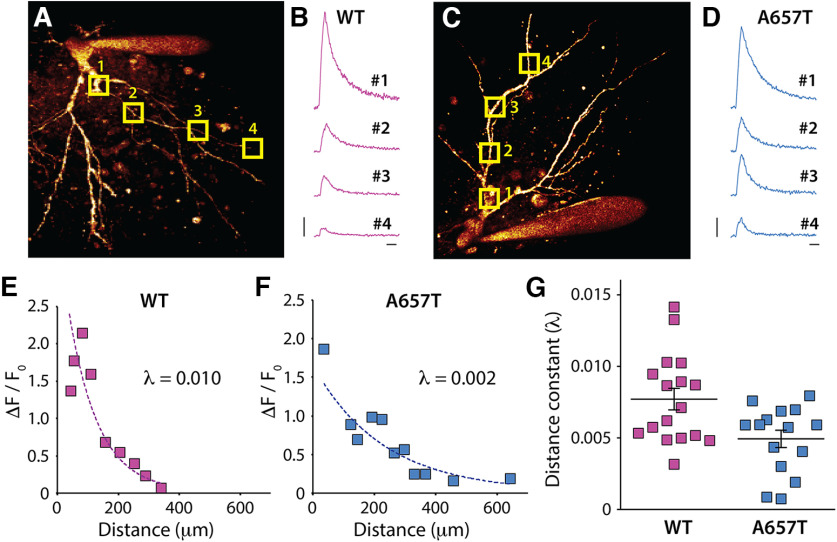
bAP evoked dendritic Ca2+ signal decays less in A657T mice. A, 2PLSM image of the soma and dendrites of a CA3 neuron in slices from WT mice filled with AlexaFluor-568 through the patch electrode. Square boxes represent ROIs as regions of scan sites for AP evoked Ca2+ measurement. B, Example fluorescence transients measured at ROIs in CA3 neurons in WT mice. C, Image of a CA3 neuron from A657T mice. D, Fluorescence transients measured at ROIs after somatic depolarization induced APs in A657T mice. B, D, Calibration: 0.25 arbitrary unit (AU), 50 ms. E, Example recording from a CA3 neuron in WT mice plotting the measured amplitude of Ca2+ signal to the distance from soma of the scanning site fit with exponential (see Materials and Methods). Inset, Time constant of the decay (λ). F, Example recording from experiment from A657T mice. Inset, Time constant of the decay (λ). G, Grouped data from all recordings of measured distance constant, λ from exponential fits of dendritic Ca2+ evoked by APs in WT and A657T mice.

