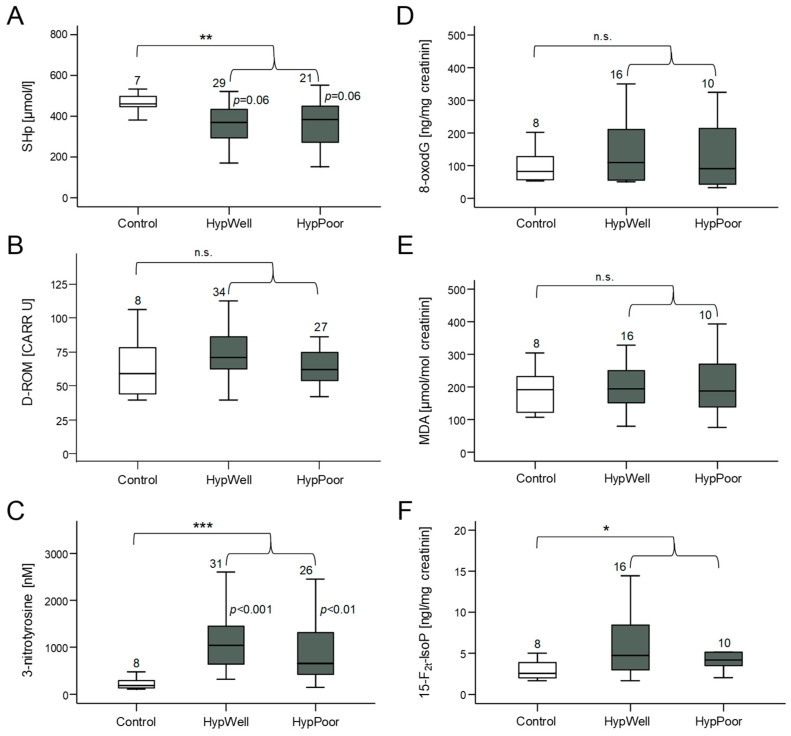
Figure 1.
Markers of oxidative stress and antioxidant potential measured in plasma and in urine. (A) Amount of SHp (free thiol groups in proteins) as a marker of antioxidant potential in plasma. (B) Quantification of D-ROM (derivatives of reactive oxygen species) as a marker of lipid oxidation in plasma. (C) Measurement of 3-nitrotyrosine as a marker of nitrosative stress to proteins in plasma. (D) Detection of the oxidative DNA base-pair modification 8-oxodG excreted in urine. Quantification of (E) MDA (malondialdehyde) and (F) 15-F2t-IsoP (15-F2t-isoprostane) as markers of lipid peroxidation in urine. Shown in each case is the comparison between the control group, HypWell, and HypPoor, with the p values inserted next to the standard deviation bar. The brackets indicate the comparison of HypAll to the control. n.s. = nonsignificant, * p ≤ 0.05, ** p < 0.01, and *** p < 0.001. Numbers over the boxplots indicate the number of patient samples analyzed.

