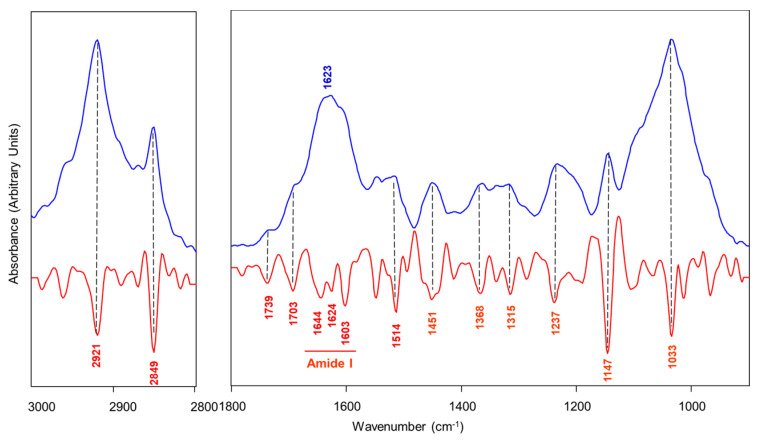
Figure 5.
Representative IR spectrum of tea leaves from Tschanara Tea Garden. The spectrum is displayed in the 3000–2800 cm−1 and 1800–900 cm−1 ranges both in absorbance (blue line) and second derivative (red line) modes, to better identify the most significant peaks which are marked together with the position (wavenumbers).

