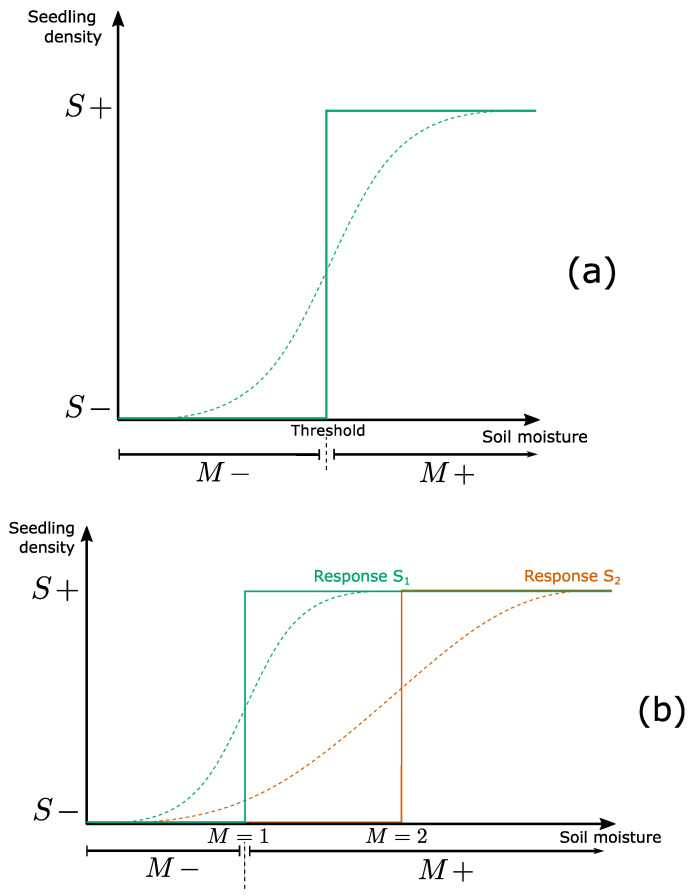
Figure 6.
Threshold-based quantization of continuous dynamics. (a): Curves representing the interaction between soil moisture M and seedling density S (and corresponding to the rules and ). The sigmoid curve (dotted line) illustrates one possible monotonically increasing function linking the two variables. The continuous line corresponds to its step-function (Boolean) approximation. For the sake of representation, the threshold between and is clearly positioned but may be more fuzzy in reality. (b): Comparison between the Boolean and multivalued representations of interactions. Sigmoid curves represent the effect of soil moisture on the germination of two species and . In the Boolean abstraction (+ and − intervals on x-axis), there is no difference between specific thresholds. Therefore, if moisture is sufficient for one species, then it is sufficient for all. Inspired from [109].

