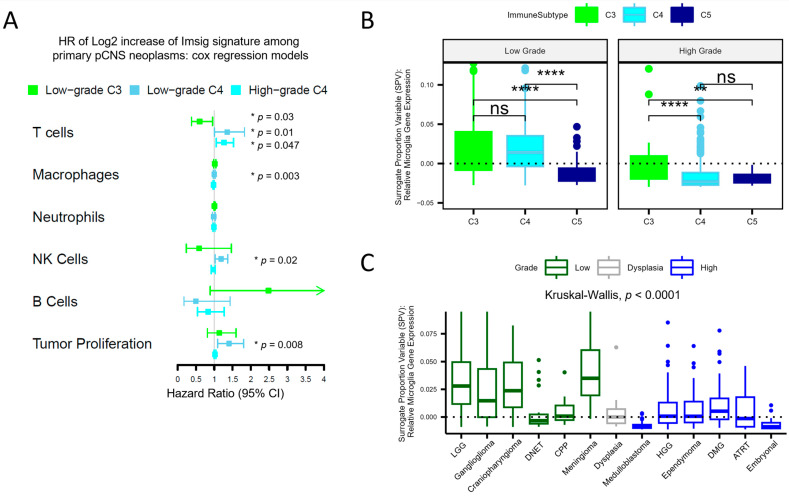
Figure 2.
Deconvolution reveals differential immune cell infiltration based on the immune subtype. T-cell signature impacts survival parameters differentially depending on the immunologic context. (A) Three Cox regression models were employed to investigate the impact of immune cell abundance (Table 1) on survival parameters. The high-grade C4 model is adjusted for resection extent and diagnosis code, and the low-grade models are adjusted for resection extent. For low-grade tumors, T-cell abundance in C3 exhibits improved PFS (HR 0.60, p = 0.03), whereas for the C4 subtype, increasing T-cell abundance is associated with worse OS (HR 1.3, p = 0.013) and worse PFS (HR 1.4, p = 0.047) in high-grade and low-grade tumors, respectively. Table S1 displays the full model results. (B,C) Information on microglia, unique to the CNS, is not captured by the immune subtype classification. Here, the relative abundance of microglia gene signatures, expressed as a surrogate proportion variable, is shown stratified by immune subtype (B) and diagnosis (C). In low-grade tumors, C3 and C4 exhibit comparable microglia abundance, whereas that of C5 is lower; high-grade C3 demonstrates higher microglia abundance compared to high-grade C4 and C5 (Kruskal–Wallis H test, where * = p < 0.05, ** = p < 0.01, **** = p < 0.0001, ns = not significant). High-grade tumors exhibit comparable microglia abundance in samples of cortical dysplasia, whereas low-grade tumors exhibit increased microglia abundance (ANOVA Tukey HSD p adj = 0.97 and <0.001, respectively; dashed lines represent median SPV values for dysplasia).

