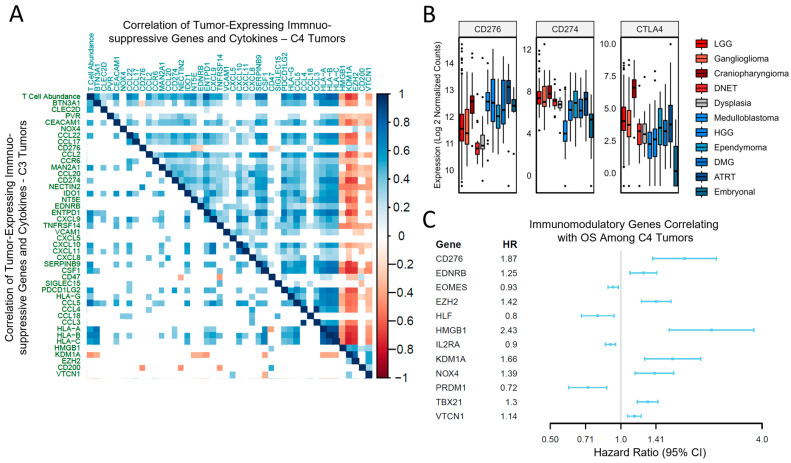
Figure 3.
Mechanisms of immunosuppression differ depending on the immune subtype, with many immunomodulatory genes impacting survival parameters across tumor types. (A) Spearman-based correlation analysis was performed to identify tumor-produced immunosuppressive genes and cytokines (Table S1) that correlate with increasing T-cell abundance, and genes for MHC class 1 (HLA-A, B, and C) are additionally included. Colored tiles demonstrate either positive (blue) or negative (red) significant correlations (Bonferroni-adjusted p < 0.05 threshold). This correlation matrix shows how the T-cell score correlates with each immune gene (first row/column), as well as the correlations for each immune gene with one another. For C4 tumors, the Imsig T-cell score strongly correlates with a large portion of these genes compared to C3 tumors. In general, the correlations among the immune genes in the C4 cluster are highly correlated with one another, but this pattern does not appear in C3. In C4 tumors, HMGB1, KDM1A, EZH2, CD200, and VTCN1 exhibit a negative correlation with T-cell abundance and correlate negatively with HLA class I expression. (B) Relative to dysplasia, neither PDL1/CD274 (ANOVA Tukey HSD p adj = 0.03 for decreased expression) nor CTLA4 (p adj = 0.55) demonstrate increased expression among high-grade lesions, whereas alternative immune checkpoints, e.g., CD276, demonstrate enhanced expression (p adj < 0.001). (C) Individual genes with tumor immunomodulatory functions are implicated with OS among C4 tumors, including various transcription factors and immune checkpoint targets. Statistically significant genes in the univariate analysis are displayed. Increased expression of CD276, EDNRB, EZH2, HMGB1, KDM1A, NOX4, TBX21, and VTCN1 lower OS among all C4 tumors.

