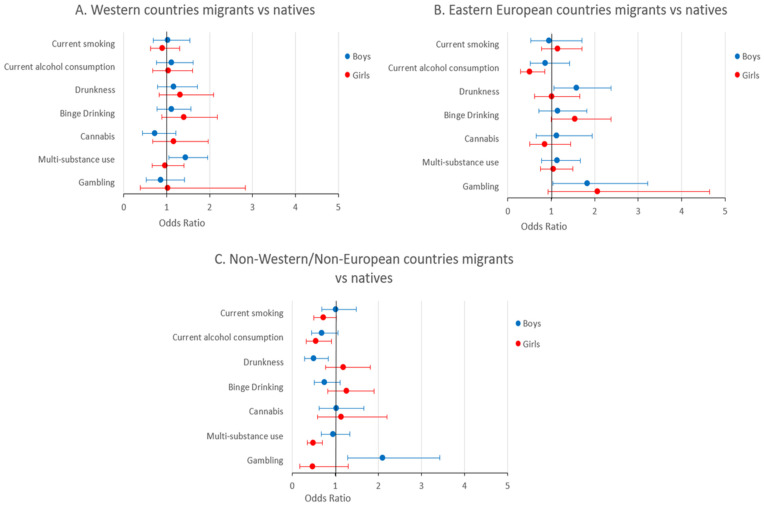
Figure 1.
Forest plot illustrating the odds ratios (represented as points) and corresponding 95% confidence intervals (represented as bars) of risk behaviors among migrant students from Western countries (A), Eastern European countries (B), and non-Western/non-European countries (C), compared to their native peers. Different regression models were performed for boys (blue) and girls (red).

