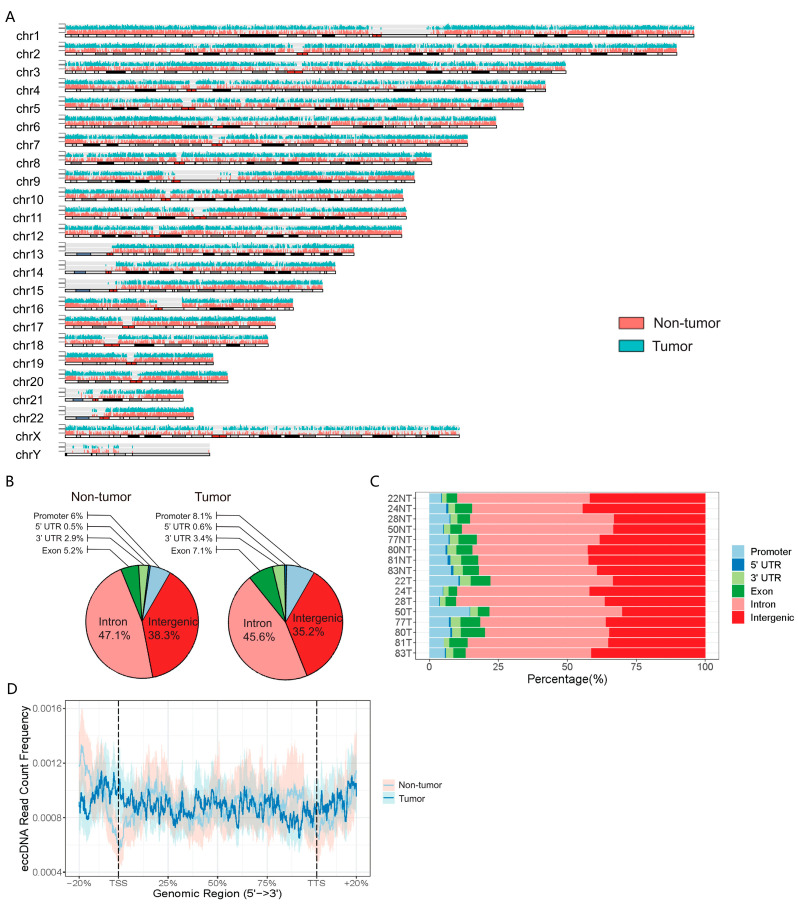
Figure 2.
Genomic distribution of eccDNAs in the paired HCC and adjacent non-tumor tissues. (A). Chromosome ideogram with genome-wide somatic eccDNA density as inferred from liver tumor tissue compared to adjacent non-tumor tissue (Line height indicated the copies of eccDNA in the corresponding genome locus). (B). Percentage of the eccDNA types that were distributed in different genomic regions as indicated. (C). Genomic region distribution of eccDNAs in the indicated tissue samples. (D). The density of the eccDNAs mapped to the protein coding gene region. TSS, transcription start site. TTS, transcription termination site.

