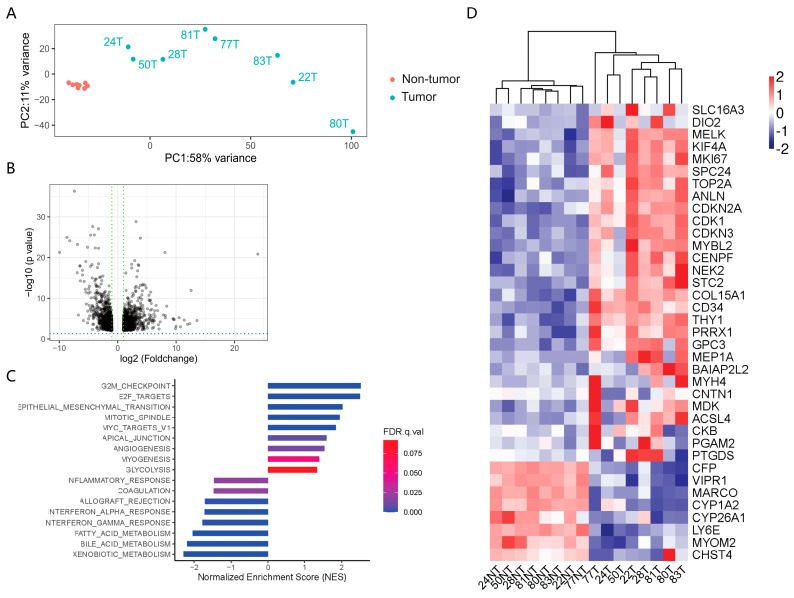
Figure 4.
Transcriptomic profiling of the paired HCC and adjacent tissue samples. (A). PCA plot showing the clustering of HCC tissue and the adjacent non-tumor tissue. The variance was present between HCC tissue and adjacent non-tumor tissue on PC1. (B). Volcano plots of gene expression changes (HCC tissues vs. adjacent non-tumor tissues). p-values were estimated using the Benjamini–Hochberg method. (C). Pathway enrichment analysis based on the DEGs. (D). Heatmap of the top DEGs identified based on the eight paired samples.

