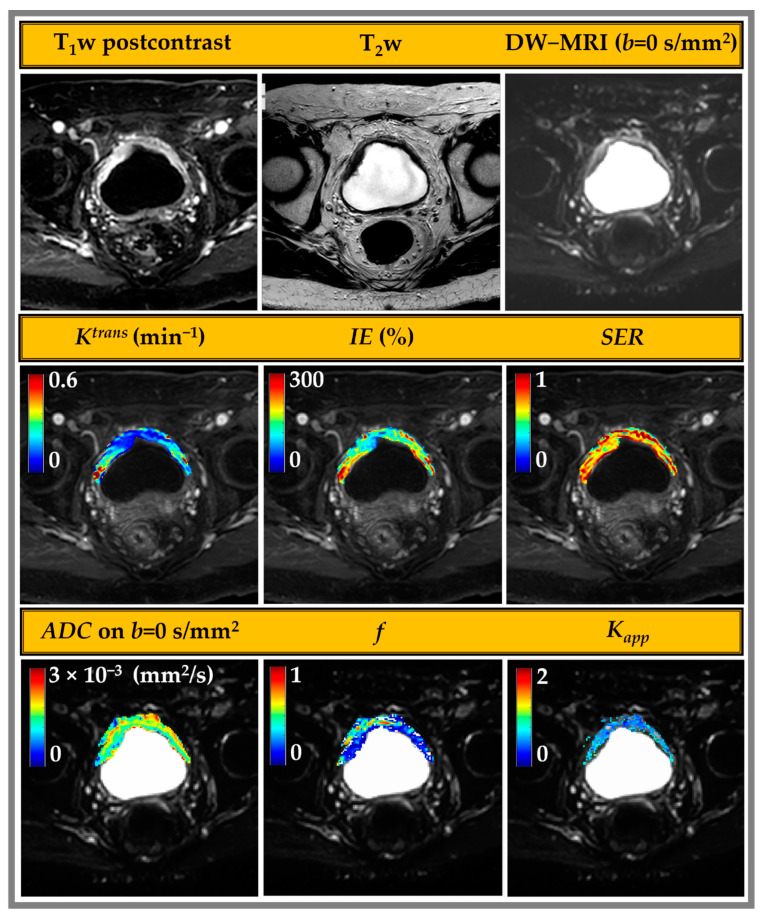
Figure 2.
mpMRI images acquired for a 72-year-old male patient with bladder cancer. The top row shows the single slice images of the bladder (left to right): delayed-phase T1w (20-phase DCE-MRI, 7s sampling), T2w, and b-value = 0 s/mm2 DW-MR image. The middle row shows tumor overlays of volume transfer constant (Ktrans), initial enhancement (IE)%, and signal enhancement ratio (SER) derived from DCE. The lower row shows the overlay maps for DW-MRI-derived metrics (left to right): perfusion-suppressed apparent diffusion coefficient (ADC (b = 100, b = 800)), perfusion fraction (f), and apparent Kurtosis coefficient (Kapp).

