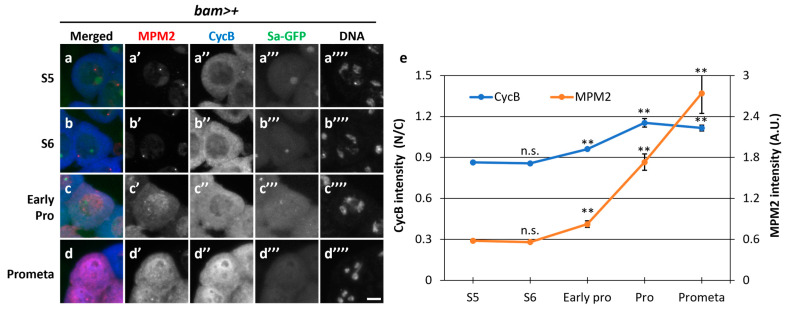
Figure 3.
Timing of full-scale Cdk1–CycB activation and nuclear re-entry of CycB at the onset of meiotic division. (a–d) Fluorescent images of mature spermatocytes co-immunostained with anti-MPM2 and -CycB antibodies before (a,b) and immediately after the onset of meiosis (c) and during meiosis (d). Images show anti-MPM2 (red in (a–d), white in (a’–d’)) and anti-CycB (blue in (a–d), white in (a’’–d’’) immunofluorescence, Sa-GFP fluorescence for visualizing the nucleolus (green in (a–d), white in (a’’’–d’’’)), and DNA staining with DAPI (white in (a’’’’–d’’’’)). Scale bar: 10 μm. (e) Quantification of anti-MPM2 and nuclear anti-CycB immunostaining intensities at each stage represented in (a–d). The anti-CycB and anti-MPM2 immunofluorescence intensities of the spermatocytes at S5 to prometaphase I (Prometa) were measured. The ratio of the anti-CycB intensity in the cytoplasm to that in the nucleus (N/C intensity) was displayed by a blue line. The fluorescence of the MPM2 epitopes (AU) is displayed by an orange line. Analyses were performed on 71 cells in S5, 133 cells in S6, 30 cells in early prophase, 24 cells in prophase, and 7 cells in prometaphase. Data are presented as means ± SEMs. Significance was tested using one-way ANOVA followed by Bonferroni’s post hoc comparison tests. ** p < 0.01, n.s.: not significant.

