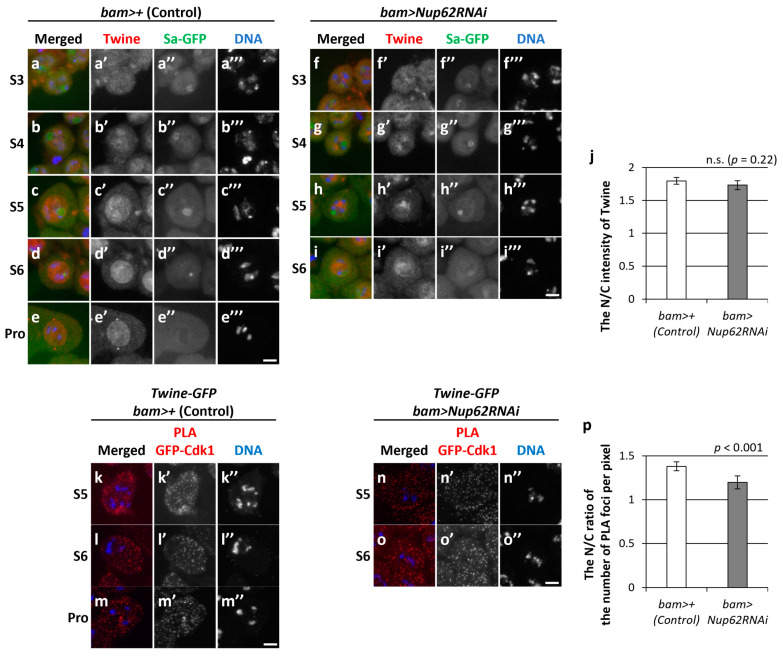
Figure 6.
Intracellular localization of Twine and in situ PLA to monitor a close association between Cdk1 and Twine. (a–i) Anti-Twine immunostaining of normal (a–e) and Nup62-depleted (f–i) spermatocytes from S3 to S6 of the growth phase (a–d,f–i) and prophase I (Pro) (e). Images show anti-Twine immunofluorescence (red in (a–i), white in (a’–i’)), Sa-GFP fluorescence for visualizing the nucleolus (green in (a–i), white in (a’’–i’’)), and DNA staining with DAPI (blue in (a–i), white (a’’’–i’’’)). Scale bar: 10 μm. (j) Ratio of the intensity of anti-Twine immunofluorescence in the nucleus to that in the cytoplasm. The fluorescence intensity of the spermatocytes at S5 was measured. The mean ratio of the intensity in the cytoplasm to that in the nucleus (N/C intensity) was displayed as a white bar (control cells) or a gray bar (Nup62RNAi cells). Data are presented as means ± 95% Cis (n > 18 cells). Significance was tested by the Mann–Whitney test. (k–o) In situ PLA to detect the close interaction between Cdk1 and Twine in normal (k–m) and Nup62-silenced (n,o) spermatocytes at the pre-meiotic stage (k,n at S5; l,o at S6) and prophase I (Pro) (m). Scale bar: 10 μm. (p) Ratio of the number of PLA signals in the nucleus to that in the cytoplasm. The number of PLA-positive foci in the nucleus or cytoplasm of each spermatocyte at the S5 stage was counted. The number per pixel in each compartment was calculated. The mean ratio of the number in the cytoplasm to that in the nucleus (N/C intensity) was displayed as a white bar (control cells) or a gray bar (Nup62RNAi cells). Data are presented as means ± 95% CIs (n > 300 cells). Significance was tested by the Mann–Whitney test. n.s.: not significant.

