Figure 8.
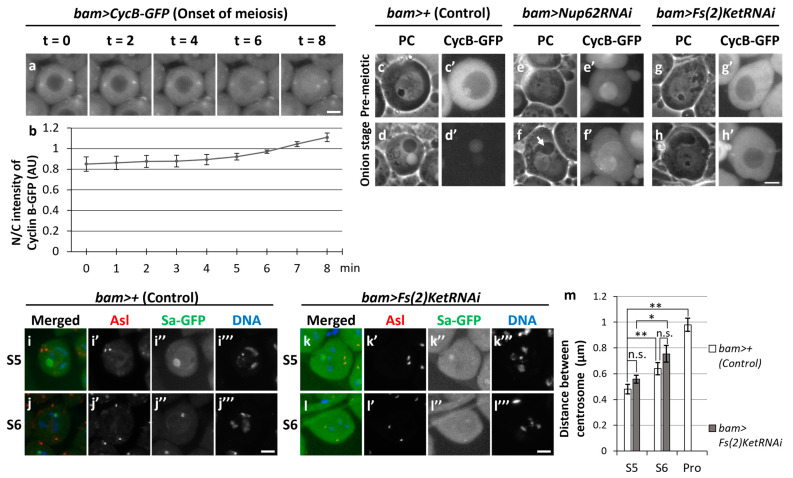
Silencing of Fs(2)Ket resulted in the failure of meiotic divisions in spermatocytes and subsequent spermatid differentiation without meiosis. (a) Time-lapse observation of CycB–GFP fluorescence in living mature spermatocytes at the onset of meiosis. Ten images were captured every minute from the timepoint when a pair of centrosomes reached opposite poles (t = 0). Four selected images of a living spermatocyte are presented. Scale bar: 10 μm. (b) Quantification of nuclear fluorescence intensity of GFP relative to that in the cytoplasm of spermatocytes. The fluorescence intensities in the spermatocytes at the time indicated by t = 0 to 8 min were measured in whole cell regions. The mean ratio of the intensity in the cytoplasm to that in the nucleus (N/C intensity) was displayed by a solid line. Data represent means ± 95% CIs (10 spermatocytes). (c–h) Fluorescence micrographs of living spermatocytes or spermatids. (c’–h’) CycB–GFP fluorescence in pre-meiotic spermatocytes harboring nucleoli (c,e,g) and onion-stage spermatids (d,f,h). Relatively dark spheres in phase-contrast micrographs of spermatocytes correspond to nucleoli. A white or light sphere and darker round or ellipsoid forms represent the nucleus and Nebenkerns, respectively. (c,d) Normal control cells (bam>+). (e,f) Nup62RNAi cells (bam>Nup62RNAi). (g,h) Fs(2)KetRNAi cells (bam>Fs(2)RNAi). Growth stages of cells were determined according to the size and morphology of the nucleolus. Scale bar: 10 μm. (i–l) Anti-Asl immunostaining (red in (i–l), white in (i’–l’)) of spermatocytes at S5 (i,k) and S6 (j,l). (i,j) Control spermatocytes (bam>+). (k,l) Spermatocytes harboring Fs(2)KetRNAi (bam>Fs(2)RNAi). Growth stages were determined using Sa-GFP fluorescence. (m) Quantification of the distance between paired centrosomes of spermatocytes from S5 to ProI. The length between paired centrosomes were measured in each spermatocyte and the mean length was displayed as a white bar (control cells, bam>+) or a gray bar (Fs(2)RNAi; bam>Fs(2)RNAi). Data are presented as means ± SEMs (n > 38 cells). No ProI cells were observed in bam>Fs(2)KetRNAi testes. Significance was tested by one-way ANOVA followed by Bonferroni’s post hoc comparison. * p < 0.05, ** p < 0.01. n.s.: not significant.

