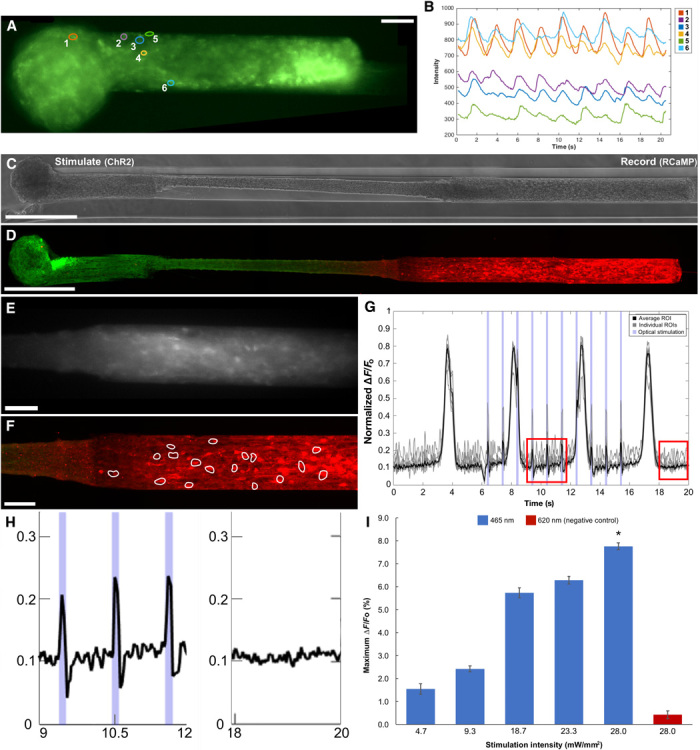
Fig. 4. Calcium imaging and optical stimulation in aggregate μTENNs.

(A) Representative GCaMP+ μTENN at 10 DIV with single-neuron ROIs outlined. (B) Average fluorescent intensities of the ROIs from (A) recorded over time indicate neuronal activity similar to constructs in earlier work (15). Intensity traces are normalized to a background (empty) region. Phase image (C) and confocal reconstruction (D) of a μTENN at 10 DIV in vitro, virally transduced such that the left aggregate expresses ChR2 (optical actuator) and the right aggregate expresses the calcium reporter RCaMP, enabling simultaneous control and monitoring with light. (E) The RCaMP+ aggregate from (C) and (D) under fluorescent microscopy during recording (16 frames per second). (F) Confocal image of the RCaMP+ aggregate poststimulation. ROIs containing single neurons were manually defined (white outlines). (G) Normalized pixel intensity of ROIs within the RCaMP+ aggregate from (A) to (C) during stimulation. Gray lines indicate representative, user-defined ROIs randomly selected for analysis, which were averaged to obtain a mean ROI of the aggregate (solid black line). A single train of 1-Hz, 100-ms stimulation pulses is shown as blue bands along the abscissa. The changes in pixel intensity due to stimulation of the input aggregate can be seen as sharp spikes occurring within the endogenous, large-amplitude slow-wave activity. (H) Zoom-ins of the red insets from (D) showing μTENN activity during (left) stimulation and after (right) optical stimulation. (I) Average maximum ∆F/Fo across stimulation intensities. Although the maximum ∆F/Fo trended upward, the differences were not significant across intensities. Statistical comparison revealed that stimulation with the control wavelength (620 nm) yielded significantly lower maximum ∆F/Fo than with 465 nm (*P < 0.05). Scale bars, 100 μm.
