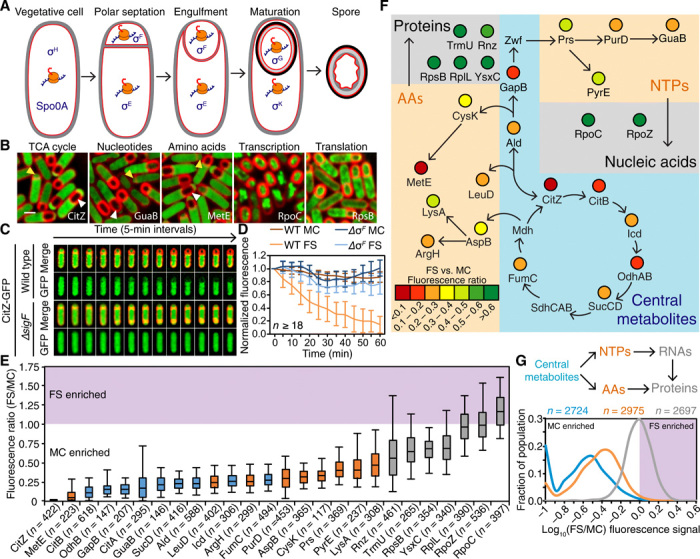
Fig. 1. Metabolic reprogramming during sporulation.

(A) Sporulation pathway in B. subtilis. Membranes, red; spore integuments, gray and black. Transcription factors active at each stage are indicated in blue, and active protein synthesis is indicated by orange ribosomes. (B) Visualization of GFP fusions (green) to representative metabolic proteins. Membranes are in red. Yellow arrowheads denote sporangia that have just completed polar septation. White arrowheads mark sporangia that have completed engulfment. Scale bar, 1 μm. See also fig. S1A. (C) Time-lapse fluorescence microscopy of a sporangium producing CitZ-GFP (green) in wild-type background and in a mutant lacking the forespore-specific transcription factor σF (ΔsigF). Membranes are in red. See also movies S1 and S2. (D) CitZ-GFP fluorescence signal in the mother cell (MC; darker shade) and in the forespore (FS; lighter shade) produced in wild-type (orange) or ∆sigF sporangia (blue) over time, relativized to the initial signal at t0. Values represent the mean ± SD. (E) Box and whisker plots showing the ratios of the mean forespore fluorescent signal to the mean mother cell fluorescence signal for metabolic enzymes functioning in different metabolic pathways. The fluorescent signals of the different fusions are normalized to cell volume and therefore represent the concentration of the different fusions in each cell. The boxes represent the middle 75% of the data, and the vertical bars represent the middle 90%. Median values are indicated by the horizontal lines inside the boxes. (F) Results from (E) superimposed on a metabolic map. AAs, xxxx; NTPs, xxxxx. (G) Histogram of forespore–to–mother cell fluorescence ratios of the GFP fusions measured in (E), grouped by tier in the metabolic hierarchy (blue, central metabolism; orange, precursor synthesis; gray, final product assembly). AAs, amino acids; NTPs, nucleoside triphosphates.
