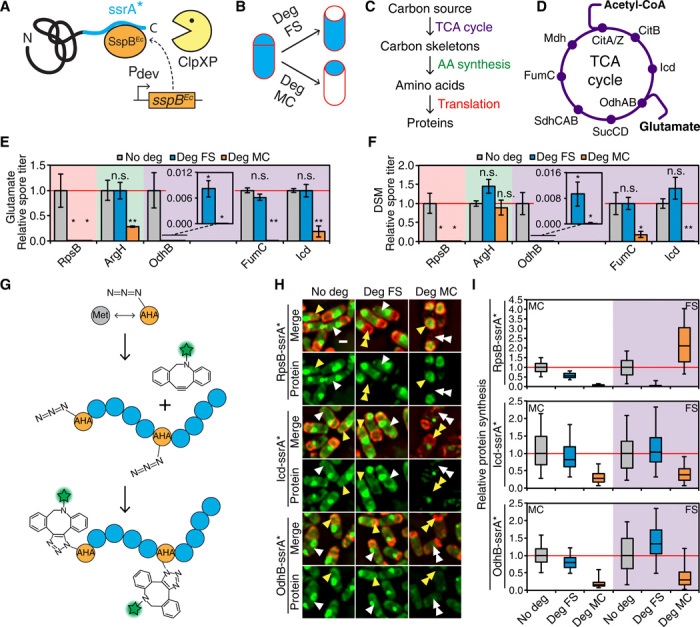
Fig. 2. Intercellular metabolic dependency during sporulation.

(A and B) STRP diagram. (C) Rationale for identifying cell-specific requirement of metabolic pathways. (D) TCA cycle diagram. Different carbon inputs in bold. (E and F) Heat-resistant spore titers of strains producing different ssrA*-tagged proteins after sporulation in a glutamate defined medium (E) or in a complex medium (DSM) (F). No degradation (No deg), gray; degradation in the forespore (Deg FS), cyan; degradation in the mother cell (Deg MC), orange. Titers of the nondegradation strains normalized to one. Data represent mean ± SEM of at least three experiments. Insets: Zoom of spore titers after OdhB-ssrA* degradation. Statistical significance (unpaired t test): n.s., not significant; *P ≤ 0.05; **P ≤ 0.01. (G) BONCAT diagram. (H) Images of sporangia producing RpsB-ssrA*, Icd-ssrA*, or OdhB-ssrA*, with BONCAT-labeled newly synthesized proteins (green). Membranes are red. White and yellow arrowheads, representative forespores and mother cells, respectively. Single and double arrowheads, high and low protein synthesis levels, respectively. Scale bar, 1 μm. (I) Protein synthesis in the mother cell (MC; white shading) and in the forespore (FS; purple shading) in RpsB-ssrA*, Icd-ssrA*, or OdhB-ssrA* strains. No degradation, gray; degradation in the forespore, cyan; degradation in the mother cell, orange. At least 142 sporangia quantified for each strain. Values normalized to the median of tagged-only strain (red line). See Fig. 1E for description of box and whisker plot.
