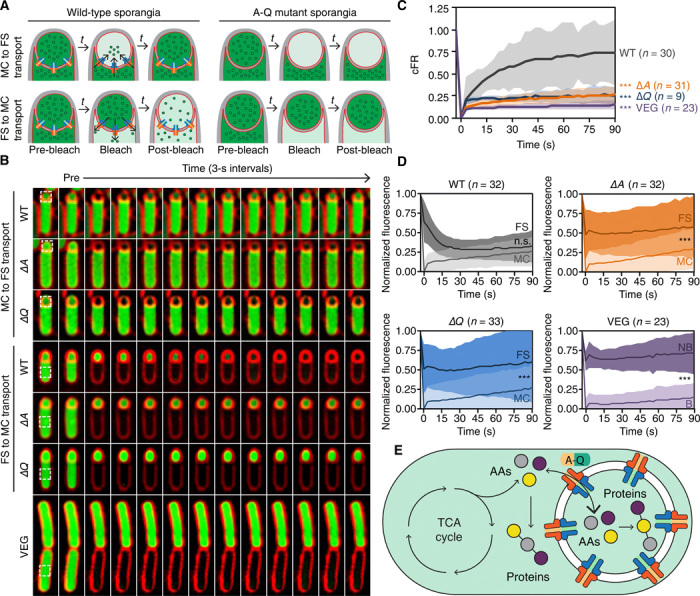
Fig. 4. A-Q is required for transport of small molecules between mother cell and forespore.

(A) Strategy to assay intercellular transport of small molecules using calcein labeling (green) and photobleaching. See main text for details. (B) Photobleaching experiments of calcein-loaded wild-type (WT), ∆A and ∆Q sporangia, or vegetative cells (VEG). Photobleached region indicated by white dotted square. See movies S3 to S9 for additional examples. (C) Fluorescence recovery of wild-type (gray), ∆A (orange), or ∆Q (blue) forespores, or vegetative cells (purple), computed as described in Materials and Methods. The average recoveries of bleached cells are indicated by solid lines, and SDs are indicated by shaded regions for each strain. The number of cells analyzed (n) for each strain is indicated to the right of the graph, and unpaired t tests were used to determine the statistical significance of the difference between each strain compared to wild type at the final time point (***P ≤ 0.001). (D) Fluorescence loss of wild-type (gray), ∆A (orange), ∆Q (blue) sporangia, or vegetative cells (VEG) (purple), normalized and corrected as described in Materials and Methods. Average fluorescence values of the forespore (dark) and mother cell (light) for each strain are indicated by solid lines, and standard deviations are indicated by shaded regions. The number of cells analyzed (n) for each strain is indicated above the respective graph, and unpaired t tests were used to determine the statistical significance of the difference between mother cell and forespore fluorescence values for each strain at the final time point (***P ≤ 0.001). NB, not bleached. (E) Model of metabolic coupling between mother cell and forespore.
