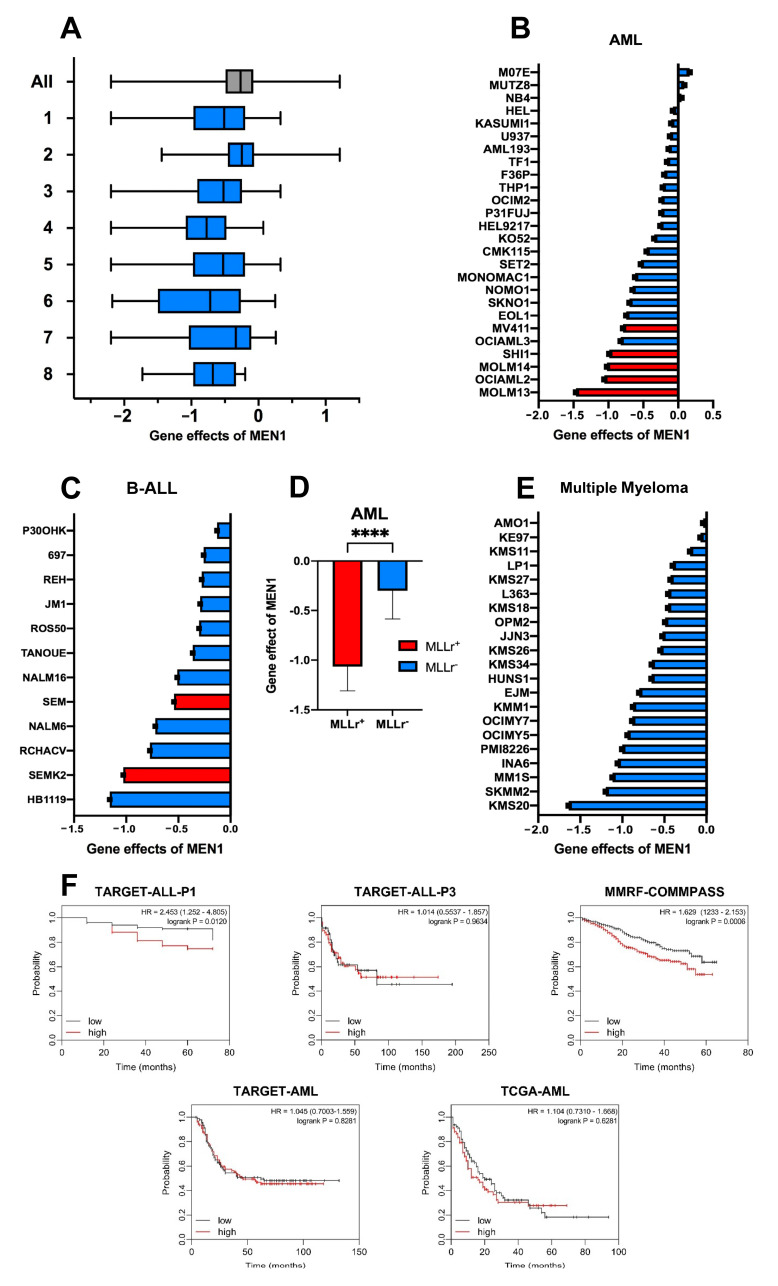
Figure 1.
MEN1 dependency is not unique to neoplasms harboring MLLr. (A) MEN1 dependency is common in neoplasms of different origins. The enriched pre-existing categories (“lineages”) with p < 0.0005 are shown. N indicates the number of cell lines plotted in each lineage. The ranking is done based on effect size in ascending order. 1. Hematopoietic and lymphoid (N = 116); 2. Solid (N = 979); 3. Lymphoid (N = 79); 4. Plasma Cell Myeloma (N = 20); 5. Non-Hodgkin lymphoma (N = 59); 6. Diffuse Large B-Cell Lymphoma (N = 14); 7. Myeloid (N = 37); 8. B-Lymphoblastic (N = 12). For estimation of MEN1 dependency we used the “gene effect score”. The gene effect scores were normalized globally so that the median of reference nonessential genes was equal 0 and the median of essential genes was equal -1 across cell lines. Dataset: CRISPR (DepMap 22Q4, Chronos, https://depmap.org/portal/gene/MEN1?tab=overview, accessed on 28 February 2023). Enriched lineages are shown, these lines are significant with p < 0.0005. “All” is shown in gray, the specific lineages are shown in blue). (B,C) MEN1-dependency of individual AML (B) and B-ALL (C) cell lines. MLL-rearranged cell lines (MLLr) are marked in red all other driver mutations are marked in blue. (D). MLLr AML cell lines are more dependent on MEN1-expression. Gene effect values of the AML cell lines driven with MLLr (red) and other oncogenic mutations (blue) shown in (B) were compared using Mann-Whitney-test (t < 0.0001 (****)). (E) Dependency of individual MM cell lines on MEN1. (F) Kaplan-Meier analysis of the association of overall survival with MEN1 expression in available B-ALL, AML, and MM cohorts. Data generated by the Therapeutically Applicable Research to Generate Effective Treatments (TARGET) (https://www.cancer.gov/ccg/research/genome-sequencing/target, accessed on 23 September 2023) initiative was mined using UCSC Xena (https://xenabrowser.net/, accessed on 20 September 2023). Study accession: phs000218, phs000465, phs000748. Statistical analysis was performed with Log-rank (Mantel-Cox) test, hazard ratio was calculated using the logrank method.

