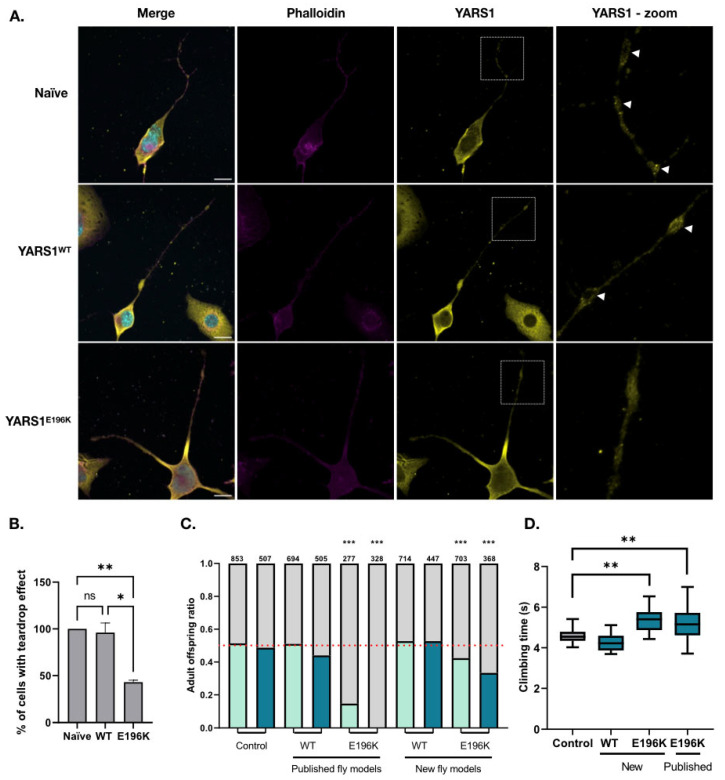
Figure 4.
Characterization of unified cellular and fly models for YARSCMT. (A) Immunofluorescence analysis of differentiated N2a cells transfected with wild-type and mutant YARS1 inducible plasmids. YARS1—yellow, nuclei—cyan, actin cytoskeleton—magenta (Scale bar = 20 µM). A zoom-in on the YARS1 staining is represented by a white box. The teardrop effect is indicated by a white arrowhead. (B) Quantification of cells displaying the teardrop effect. Statistical significance ** p < 0.01, * p < 0.1, ns—not significant was determined after one-way ANOVA analysis (n = 4). (C) Strong ubiquitous expression of YARS1WT has no effect with Actin5c-GAL4weak (light blue) and Actin5c-GAL4strong (dark blue) on the expected 1:1 adult flies eclosion ratio. YARS1E196K ubiquitous expression has detrimental effects in a dosage-dependent manner in both new and previously published models. Attp40 flies were used as a negative control. The number of adult flies ecloding is indicated above each graph bar. Dashed line marks the expected 1:1 genotypes’ eclosion ratio. Statistical significance (*** p < 0.0001) was determined after One-Way ANOVA analysis which compares the odd ratios (Actin5c-GAL4/transgene ON vs. Balancer/transgene OFF) of flies in three independent crosses. (D) Pan-neuronal expression of mutant YARS1 with nSyb-GAL4 induces locomotor performance deficits as determined in a negative geotaxis climbing assay. NSyb-GAL4 flies were used as a negative control (grey). The Y-axis indicates the time needed for the fastest fly to climb a vertical wall to a height of 82 mm. ** p < 0.01 was determined after one-way ANOVA analysis (n = 3). Both lethality and negative geotaxis assays were performed on flies carrying the transgenic construct on the second chromosome.

