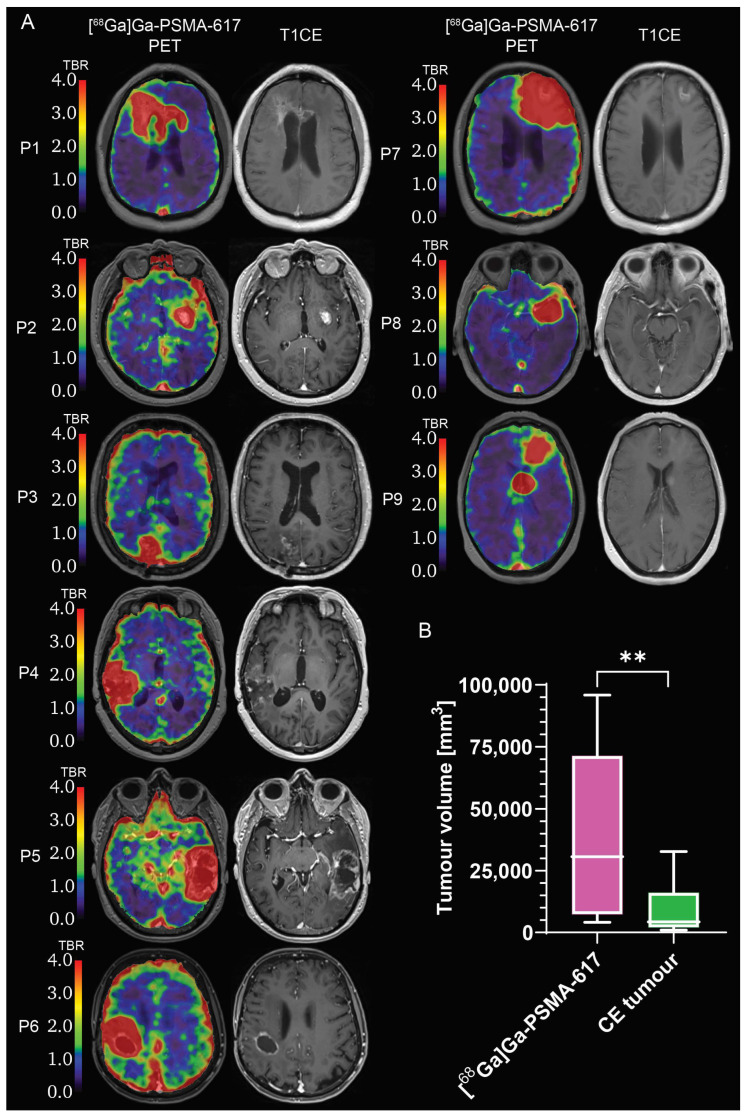
Figure 4.
Comparison between [68Ga]Ga-PSMA-617 biological tumour volume and contrast-enhancing tumour volume. (A) [68Ga]Ga-PSMA-617 TBR and T1CE images; (B) box-and-whiskers plot of the volumetric comparison between [68Ga]Ga-PSMA-617 biological tumour and CE tumour, with bar representing the median of the population. ** = p < 0.01. CE: contrast-enhancing; PET: positron emission tomography. T1CE: T1-weighted contrast-enhanced. TBR: tumour-to-brain ratio. ns = no significant difference. N = 9.

