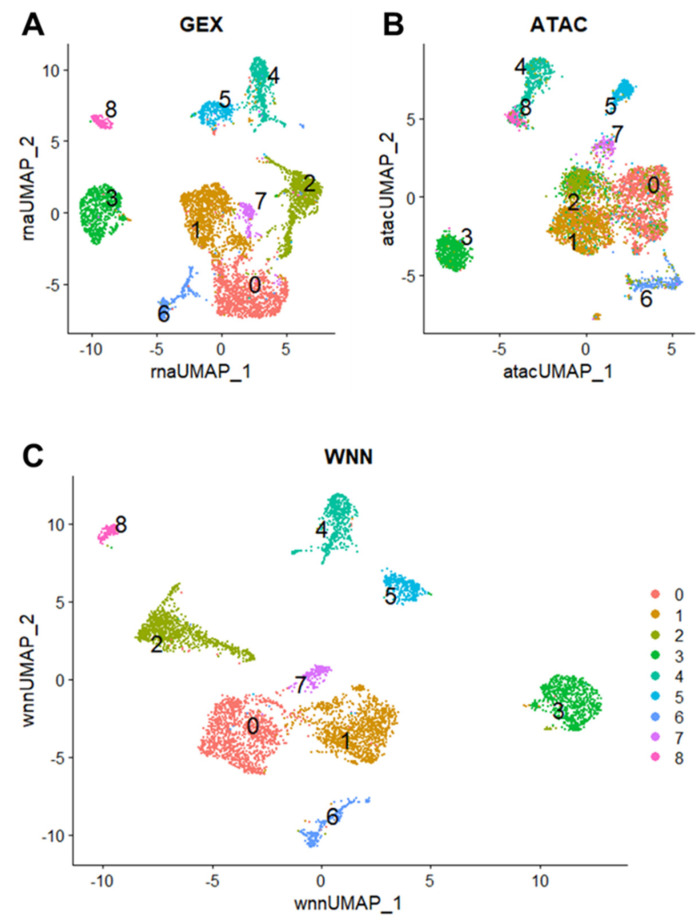
Figure 2.
Cellular heterogeneity in primary canine OSA reflected by nine cell clusters. UMAP plot shows nine total clusters (c0–8) for GEX (A), ATAC (B), and weighted nearest neighbor (WNN) graph which combines both modalities (C). Each dot represents a single nucleus, and the color corresponds to the cluster.

