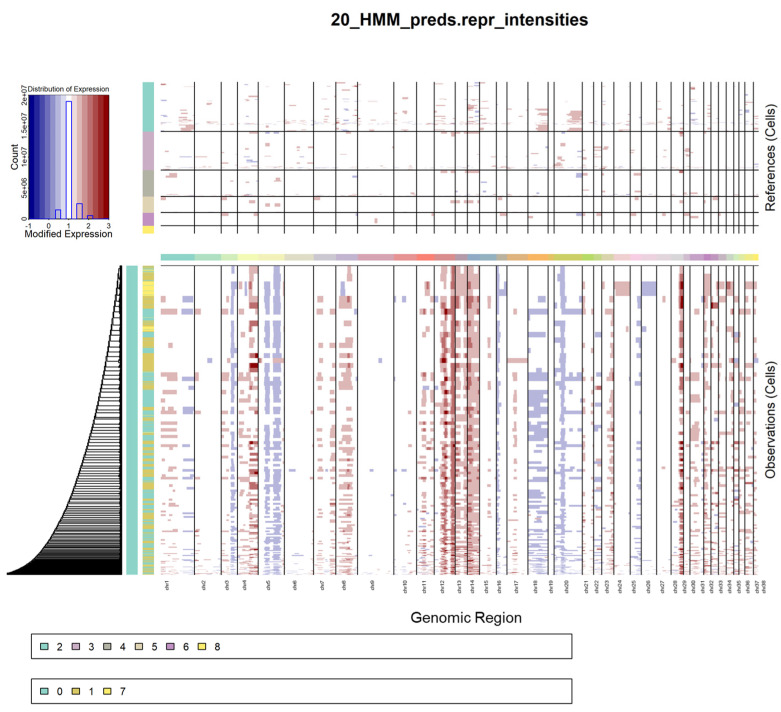
Figure 4.
Heatmap of CNVs in osteoblastic clusters. Heatmap of the CNVs identified in the osteoblast clusters 0, 1, and 7 using the remaining clusters as the reference (A). Expression values for the normal cell clusters (depicted in the top heatmap) are subtracted from tumor cluster expression data (depicted in the bottom heatmap) to visualize differences. Rows are individual nuclei, columns are genes (ordered from left to right across the chromosomes); amplifications are colored red and deletions are colored blue.

