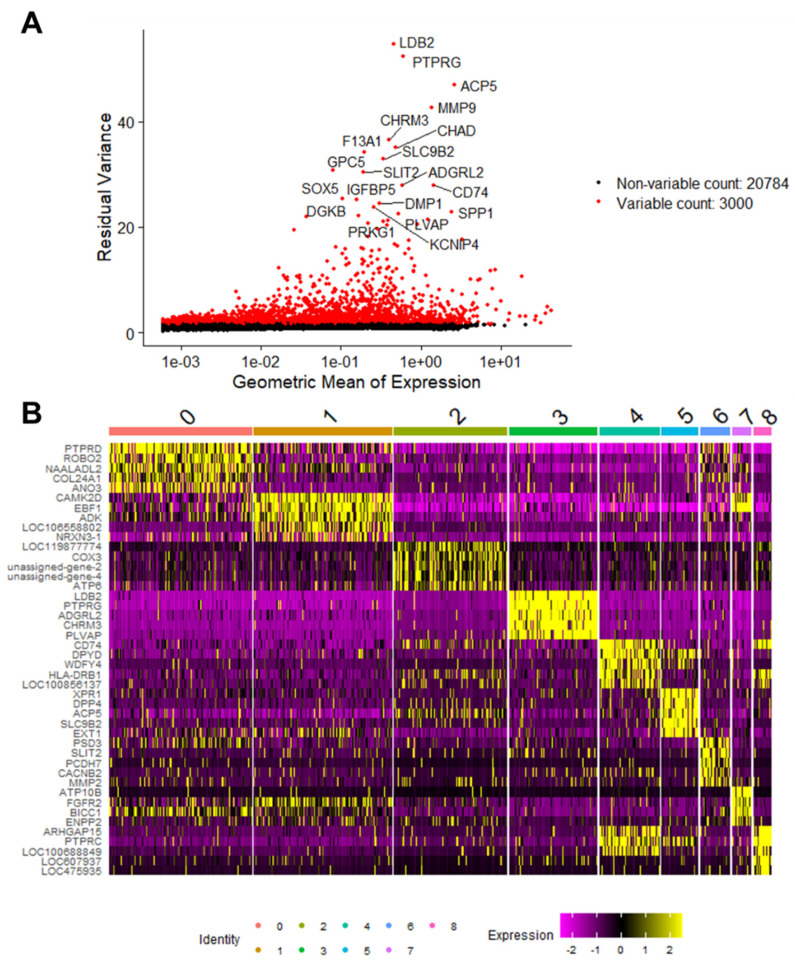
Figure 5.
Differentially expressed genes define clusters in primary canine OSA. A plot of the top 3000 variable genes in the dataset with the top 20 most highly variable genes labeled. Red dots indicate the differentially expressed genes (n = 3000), and black dots represent the non-variable genes (n = 20,784) (A). Heatmap of the top 5 differentially expressed genes in each cluster. Clusters are identified by color and number on the top x-axis, gene symbols are listed on the y-axis; yellow indicates up-regulation and pink/purple indicates down-regulation (B).

