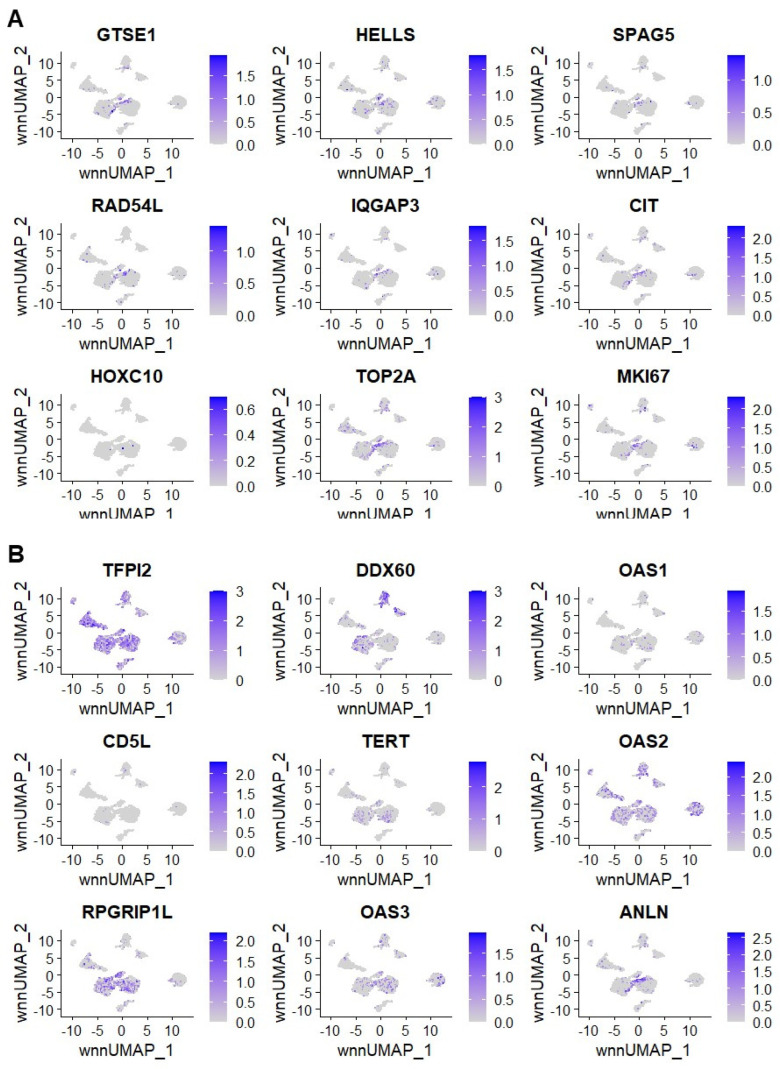
Figure 9.
Expression of the top up-regulated genes from the bulk OSA tumor/normal bone RNAseq results. Expression of marker genes derived from the bulk OSA tumor/normal RNAseq dataset for the top up-regulated genes in the group (A). Marker gene expression for the top up-regulated genes in the same patient from the bulk OSA tumor/normal RNAseq dataset (B). Darker shades of purple indicate up-regulated expression, and gray indicates zero change.

