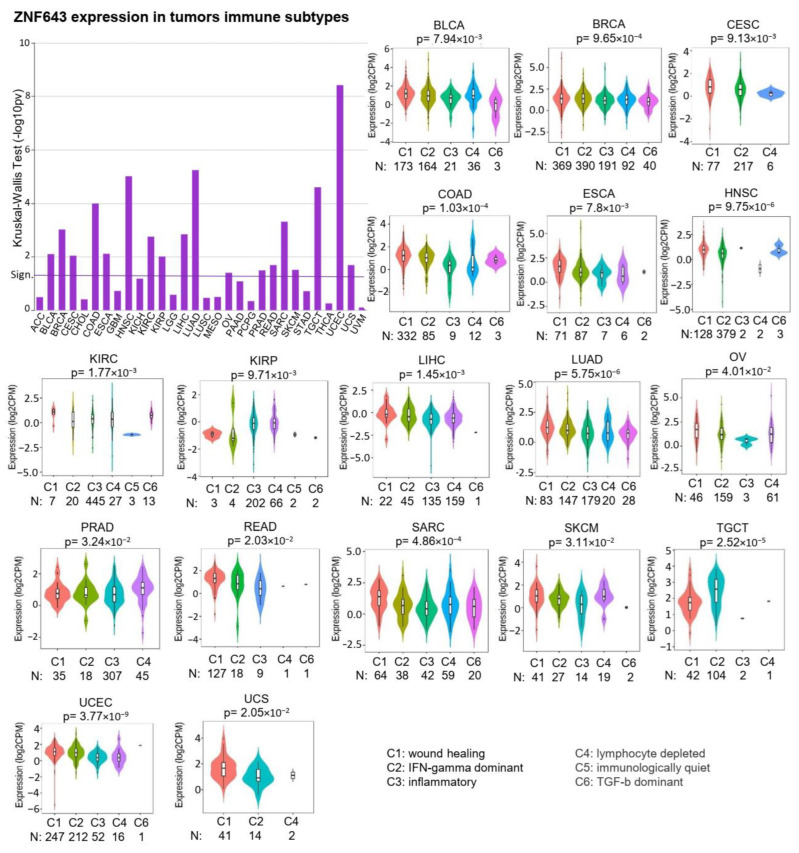
Figure 3.
ZNF643 association with tumor immune subtypes. Distinct immune subtypes (C1–C6) of analyzed TCGA tumors represent differences (Kruskal–Wallis test) in ZNF643 gene expression. Transformed p-values (−log10) are present on a barplot. Violin plots represent tumors with statistically significant expression differences, showing p-value calculated with the Kruskal–Wallis test. The number of samples within different immune subtypes is displayed below plots.

