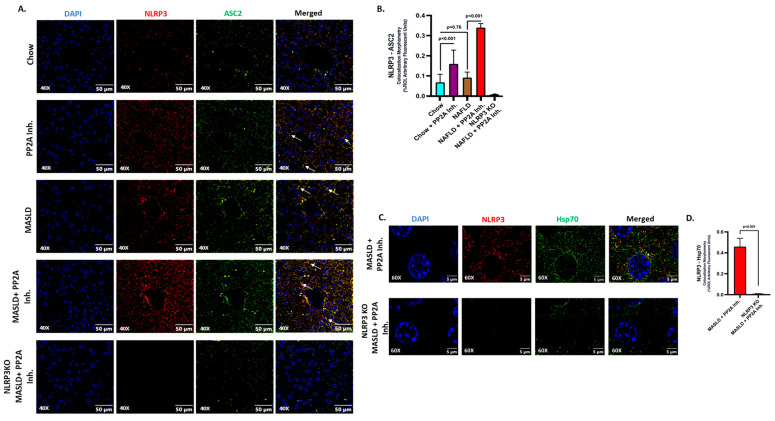
Figure 2.
NLRP3 drives the inflammatory events and interacts with Hsp70 in aggravating the hepatic injury. (A) Immunofluorescence dual labeling of NLRP3 (red), ASC2 (green), and colocalization (yellow) taken at 40× magnification, displayed with a scale of 50 μm in the liver sections from Chow, Chow + PP2A inhibitor, MASLD, and MASLD + PP2A inhibitor mouse samples. Some of the colocalization events were indicated by white arrows. (B) Morphometry of NLRP3–ASC2 colocalization (yellow) events in all the groups were measured as arbitrary fluorescent units from three separate microscopic fields and plotted along the ordinate. All p-values were determined through one-way ANOVA with the significance level set at p < 0.05. (C) Immunofluorescence dual labeling of NLRP3 (red), Hsp70 (green), and colocalization (yellow) taken at 60× magnification, displayed with a scale of 5 μm in the liver sections from MASLD + PP2A inhibitor and NLRP3 KO MASLD + PP2A inhibitor mouse samples. Some of the colocalization events are indicated by white arrows. (D) Morphometry of NLRP3–Hsp70 colocalization (yellow) events in both groups were measured as arbitrary fluorescent units from three separate microscopic fields and plotted along the ordinate. All p-values were determined through an unpaired t-test with the significance level set at p < 0.05.

