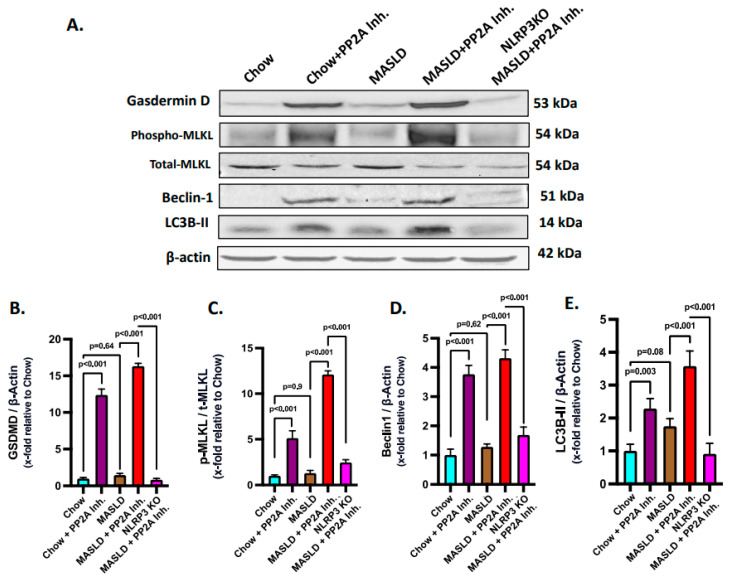
Figure 6.
NLRP3–Hsp70–TLR4 axis shifts the fulcrum of cell death and survival pathways in the liver. (A) Immunoblot analysis of gasdermin D, phospho-MLKL, total-MLKL, Beclin 1, LC3B-II, and β-actin protein level expressions from the liver lysates of Chow, Chow + PP2A inhibitor, MASLD, MASLD + PP2A inhibitor, and NLRP3 KO MASLD + PP2A inhibitor mouse samples. (B) Densitometric analysis of gasdermin D reactivity calculated as the ratio of gasdermin D to β-actin, displayed as mean and deviation (n = 3 in biological replicates). All p-values were determined through one-way ANOVA with the significance level set at p < 0.05. (C) Densitometric analysis of phospho-MLKL reactivity calculated as the ratio of phospho-MLKL to total-MLKL, displayed as mean and deviation (n = 3 in biological replicates). All p-values were determined through one-way ANOVA with the significance level set at p < 0.05. (D) Densitometric analysis of Beclin 1 reactivity calculated as the ratio of Beclin 1 to β-actin, displayed as mean and deviation (n = 3 in biological replicates). All p-values were determined through one-way ANOVA with the significance level set at p < 0.05. (E) Densitometric analysis of LC3B-II reactivity calculated as the ratio of LC3B-II to β-actin, displayed as mean and deviation (n = 3 in biological replicates). All p-values were determined through one-way ANOVA with the significance level set at p < 0.05.

