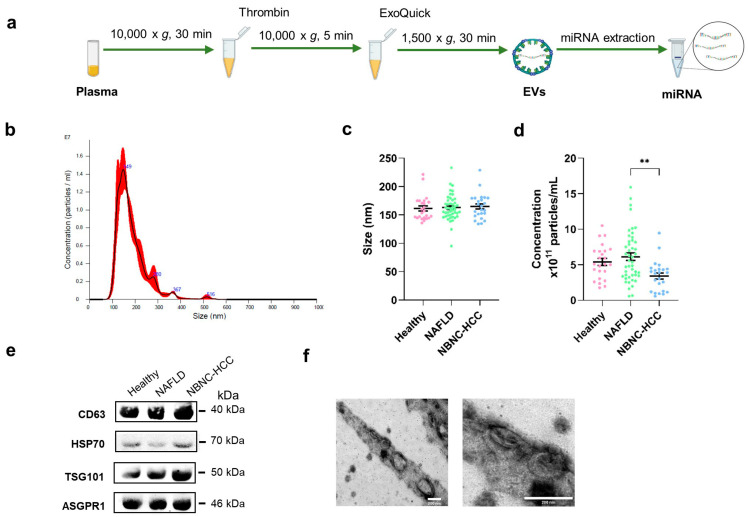
Figure 1.
Schematic diagram of the study protocol and characterization of EVs derived from plasma. (a) Diagram of plasma EV isolation protocol, (b) Representative nanoparticle tracking plot for size distribution from a sample, (c) Quantification of particle size diameter (nm), and (d) Concentration (particles/mL) of plasma EVs from the healthy control, NAFLD, and NBNC-HCC groups. (e) Expression of EV markers, CD63, HSP70, and TSG101, and hepatocyte-specific receptor, ASGPR1 by Western blotting. (f) Transmission electron microscopy images of EVs from a sample. Scale bars, 200 μm. Data are presented as means ± S.E.M, ** p < 0.01.

