Figure 4.
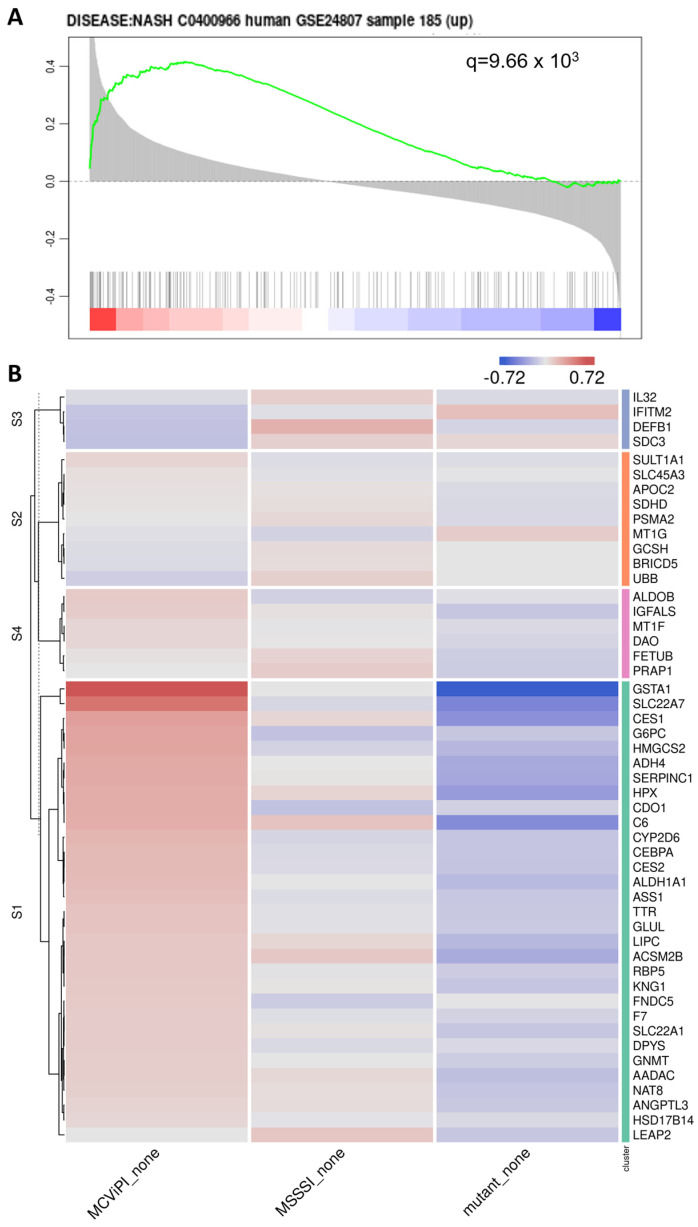
Mitochondrial GpC hypermethylation gene expression changes show enrichment of a MASLD gene signature. (A) Functional GSEA enrichment of MASLD-associated genes correlating with mitochondrial GpC methylation (MCviPI_none vs. Mutant_none). The green curve corresponds to the ‘running statistics’ of the enrichment score (ES). The more the green ES curve is shifted to the upper left of the graph, the more the gene set is enriched in the first group. Black vertical bars indicate the rank of genes in the gene set in the sorted correlation metric. FDR is represented by the q-value in the figure. The figure was generated using the Omics Playground tool (v3). (B) Heatmap representation of MASH-related gene signature (GSE24807) in 3 different HepG2 cells overexpressing a GpC DNMT MCviPI (MCviPI), a CpG DNMT (MSSSI), or overexpressing a GpC/CpG DNMT deficient MCviPI mutant. Cells were left untreated (none).

