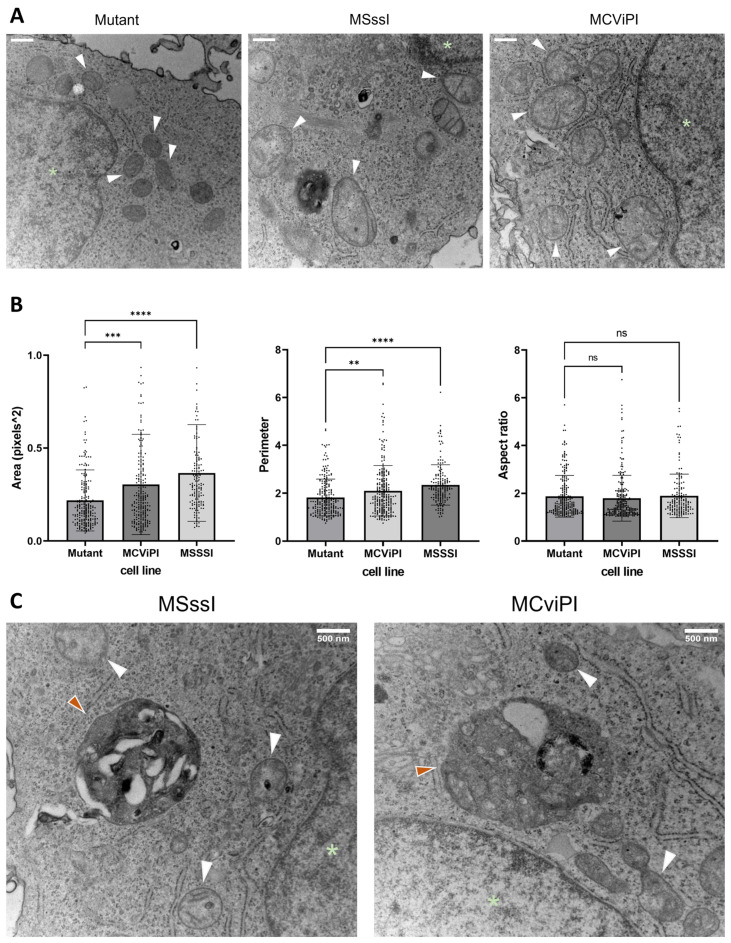
Figure 6.
Mitochondrial hypermethylation-induced morphological changes. (A) Representative images of TEM of the reference MCviPI mutant cell line and the mitochondrially CpG or GpC methylated cell lines MSssI and MCviPI, respectively. White arrowheads indicate mitochondria, and green asterisks indicate the nucleus (scale bar (upper left) represents 500 nm). (B) quantification of surface area, perimeter, and aspect ratio of the mitochondria in the three cell lines (n = 2 biologically independent samples). Each data point represents a different mitochondrium (n = 158–234 mitochondria). Data are shown as mean ± s.d.; (ns = not significant; ** p < 0.01, *** p < 0.001, **** p < 0.0001, One-way ANOVA with Dunnett’s correction for multiple comparisons). (C) Representative images of TEM imaging of the mitochondrially CpG or GpC-methylated cell lines MSssI and MCviPI, respectively. White arrowheads indicate mitochondria, a green asterisk indicates the nucleus, and orange arrowheads indicate autophagosomes.

