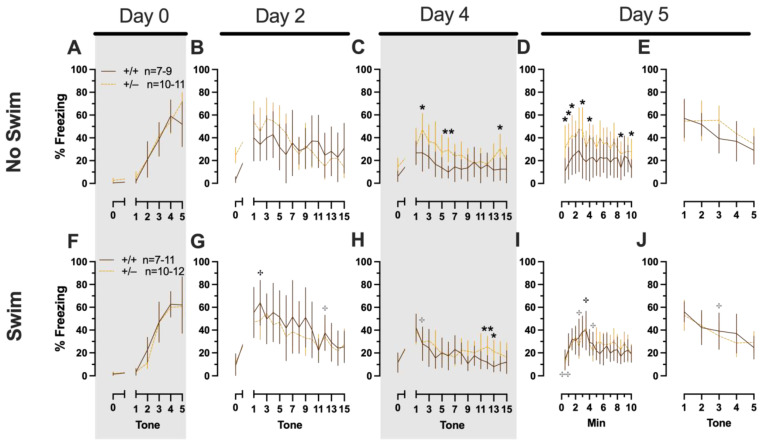
Figure 5.
Phase 2 cued fear conditioning in male mice, separated by swim condition. Male wild types are represented by orange solid lines, and male heterozygotes are represented by yellow dashed lines. Fear conditioning occurred 4 weeks after swim stress exposure for Phase 2. Mice were trained on Day 0 in Context A (A,F), then two days later (Day 2) placed in Context B (B,G), where they underwent cued fear expression testing as well as cued fear extinction training. Two days thereafter, mice underwent the identical procedure for the purposes of testing extinction retention (Day 4; C,H). One day later (Day 5), mice were placed in Context A for context fear expression (D,I). Immediately after context fear expression testing, mice were tested for cued fear renewal (E,J). Data are percent time spent freezing for each 30 s period indicated. Data were analyzed within each training/testing stage and within each sex, using 3-way repeated-measures ANOVAs (time × PMAT genotype × swim condition) and pairwise comparisons with Bonferroni correction, and are graphed as mean ± 95% confidence interval. * p = 0.023, * p = 0.015 (left to right, panel C); * p = 0.021, * p = 0.029,* p = 0.026, * p = 0.023, * p = 0.043, * p = 0.046, * p = 0.015 (left to right, panel D); * p = 0.039 (panel H); ** p = 0.002 (panel C); ** p = 0.008 (panel H) indicate difference between heterozygous and wild type within the same sex at the indicated time point. ✣ p = 0.025, ✣ p = 0.019 (left to right, panel G); ✣ p = 0.031 (panel H); ✣ p = 0.019, ✣ p = 0.035, ✣ p = 0.013 (left to right, panel I); ✣✣ p = 0.009 (panel I); ✣ p = 0.015 (panel J) indicates difference between no-swim and swim conditions within the same sex and genotype (indicated by color; black for wild-type, grey for heterozygous) at the indicated time point.

