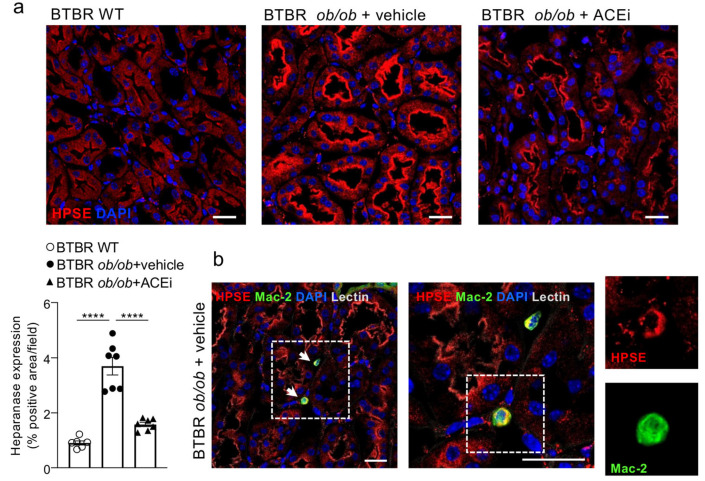
Figure 6.
Lisinopril reduces interstitial heparanase overexpression in diabetic mice. (a) Representative images and quantification of HPSE expression (in red) in cortical tubules of BTBR WT mice and diabetic BTBR ob/ob mice received vehicle or treated with the ACEi lisinopril. A positive staining is observed in the brush border of proximal tubules. Data are mean ± SEM. **** p < 0.0001. Bar = 20 µm. (b) HPSE (in red) is detected in monocyte/macrophage (Mac-2, in green) interstitial infiltrates (arrows) in diabetic mice. Boxes show merge and single stainings of HPSE and Mac-2 in one interstitial infiltrate at high magnification. Cell nuclei (DAPI, in blue), renal structures (lectin, pseudocolor). Bar = 20 μm.

