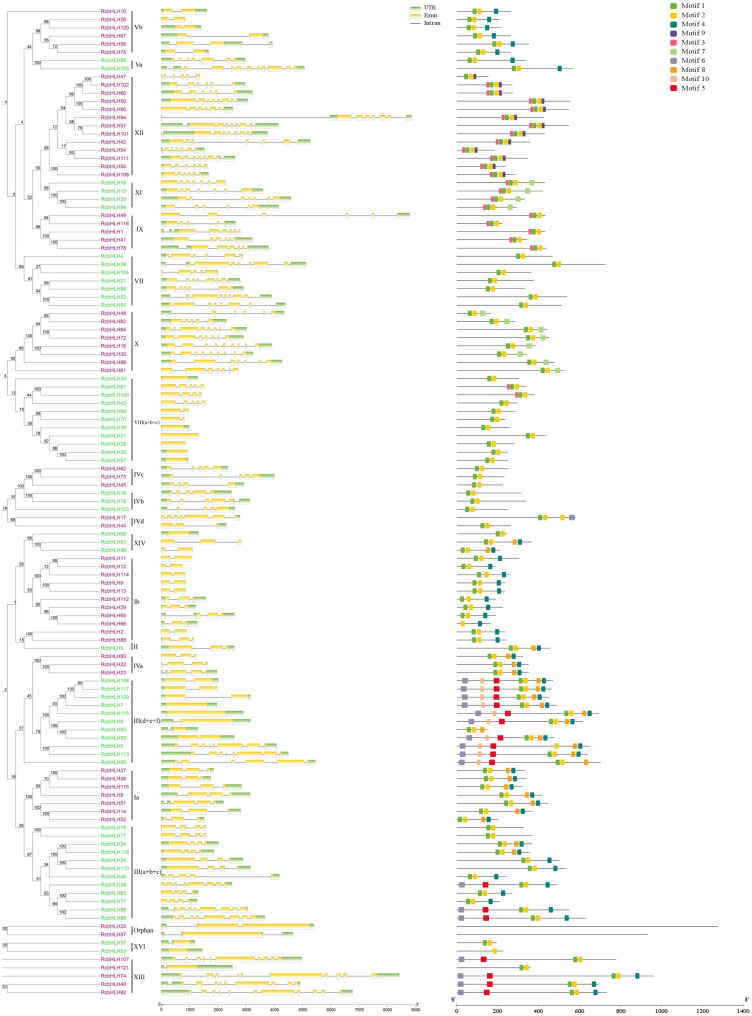
Figure 3.
Phylogenetic analyses, DNA structures and protein motifs of the bHLH gene family in rose. Complete alignments of all rose bHLH proteins were used to construct a phylogenetic tree using the neighbour-joining method. The left represents gene structures. The green boxes, yellow boxes and grey lines in the exon–intron structure diagram represent UTRs, exons and introns, respectively. The right represents protein motifs in the bHLH members. The colourful boxes delineate different motifs (unit: aa). The scale on the bottom is provided as a reference.

