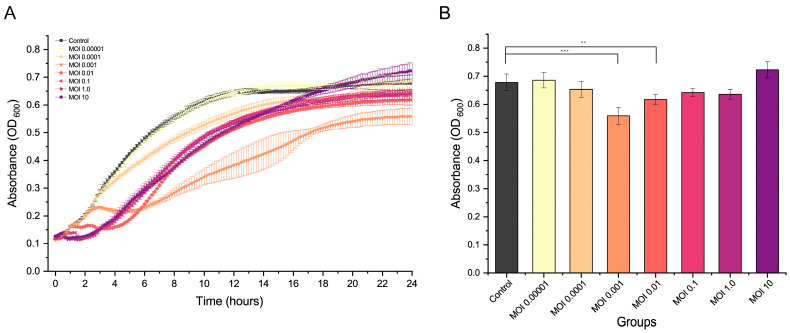
Figure 4.
In vitro lysis of vB_VhaS_R21Y at different multiplicities of infection. (A) Growth curve for V. harveyi BVH1 infected by vB_VhaS_R21Y. (B) Absorbance (OD600) of the host at 24 h. Error bars indicate standard deviation among triplicate samples. Statistical significance is indicated by ** and *** at p < 0.01 and p < 0.001, respectively, compared with the control.

