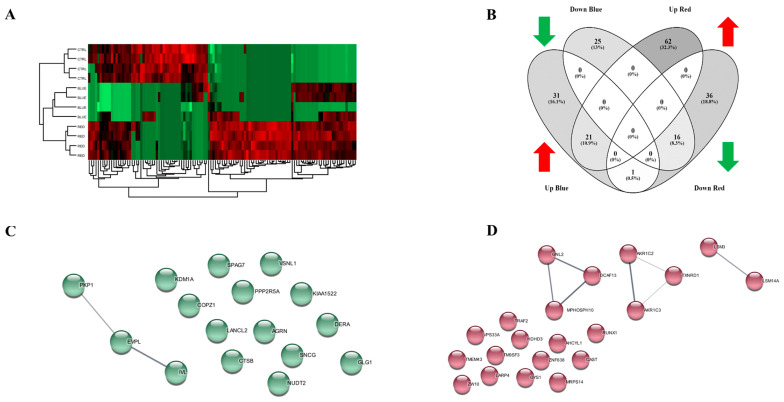
Figure 3.
Proteomic profile of HaCaT cells exposed to high-irradiance blue or red light. High-irradiance blue or red light altered the proteome of the HaCaT cells compared with the control cells as shown using hierarchical heat map clusters (A). The Venn diagram shows that there were 31, 25, 62 and 36 proteins expressed only in “Up Blue”, “Down Blue”, “Up Red” and “Down Red”, respectively. A total of 16 common proteins were expressed in both “Down Blue” and “Down Red”; 21 common proteins were identified as upregulated after exposure to high-irradiance blue or red light. (B). A STRING analysis reported by Cytoscape revealed the correlations between proteins commonly downregulated (C) and/or upregulated (D) in HaCaT cells exposed to blue or red light.

