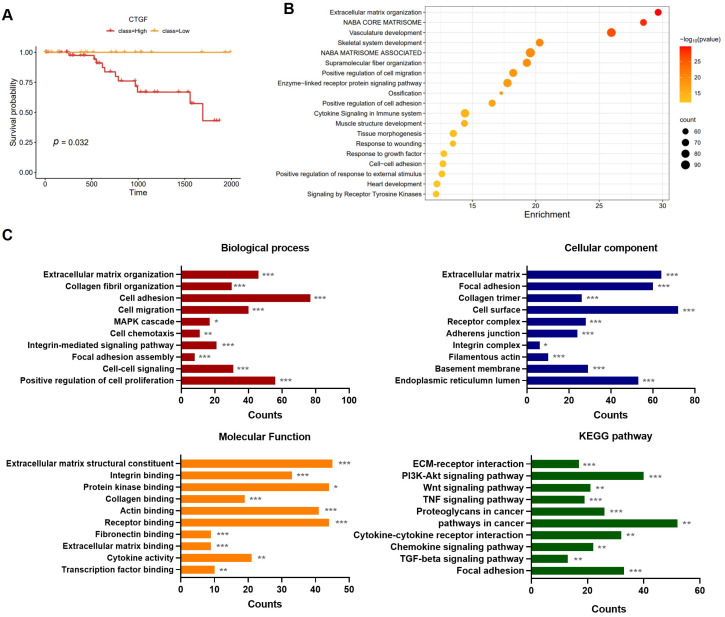
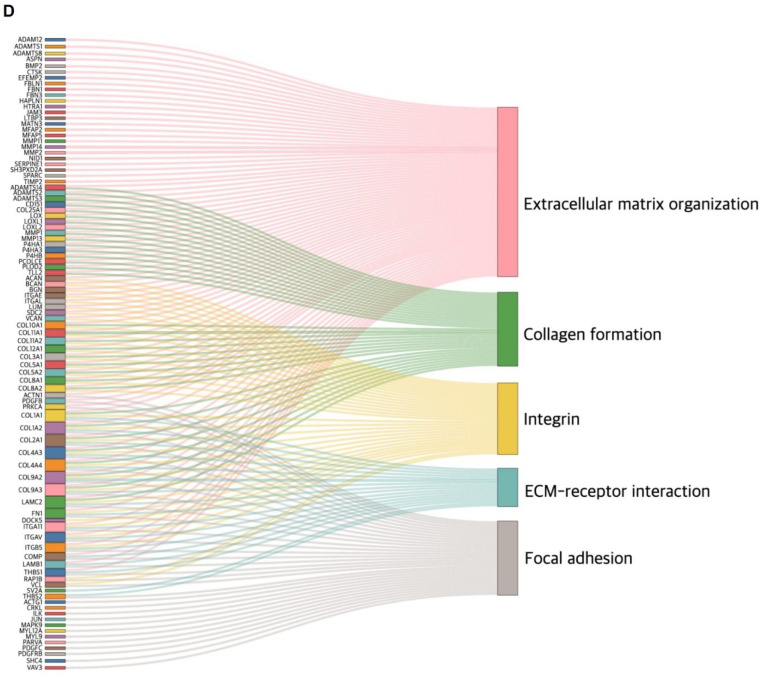
Figure 1.
CTGF implication in the survival and cancer progression of TNBC. (A) Kaplan–Meier survival plot for TCGA TNBC patient showing overall survival in the CTGF high-expression group (red, n = 65) and CTGF low-expression group (yellow, n = 32). (B) An enrichment bubble plot visualizing the selected genes. Pathway enrichment of differentially expressed genes (DEGs) between the high-CTGF and low-CTGF groups is presented; darker colors indicate lower p-values. (C) Results of GO enrichment analysis and KEGG pathway analysis for DEGs (p-value < 0.05) in the high-CTGF and low-CTGF groups. (D) Sankey plot with selected pathways via CPDB (p-value < 0.05 in over-representation analysis) based on mRNA expressions in TNBC patients (n = 97). Five migration-related pathways and genes are indicated in the Sankey plot. * p < 0.05, ** p < 0.01, *** p < 0.005.


