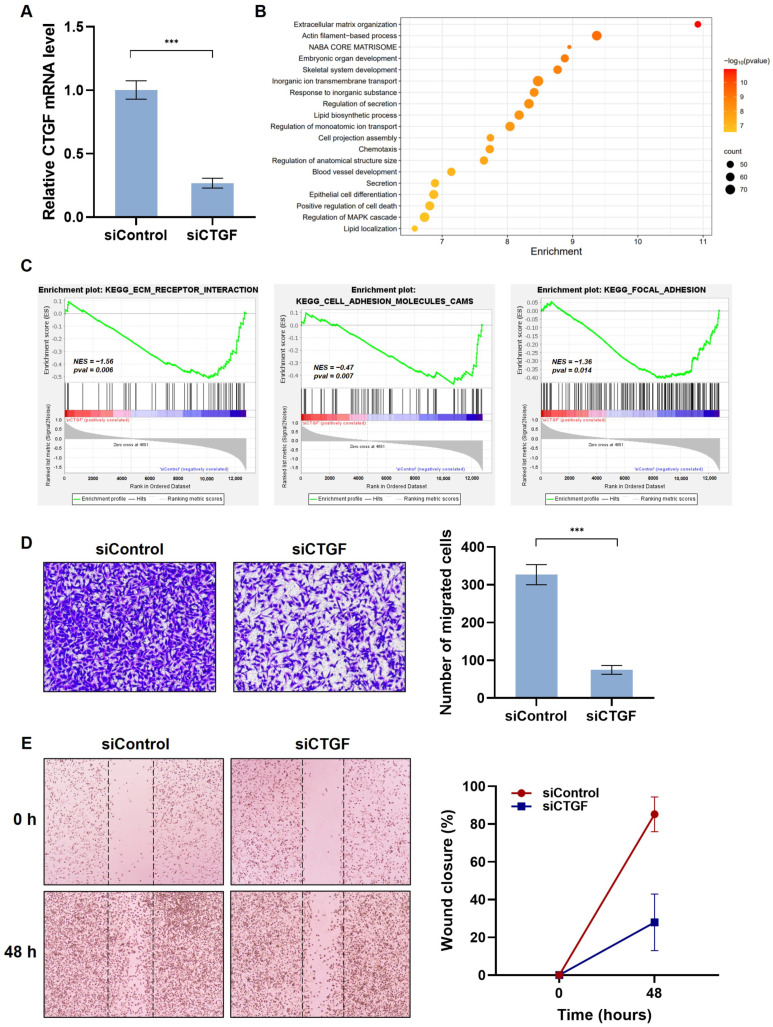
Figure 2.
CTGF involvement in TNBC cell motility. MDA-MB 231 cells were transfected with 100 nM siRNA specific for the CTGF gene or control siRNA. (A) The mRNA level of CTGF was determined by qRT-PCR analysis. (B) Enrichment bubble plot visualizing the selected genes. Pathway enrichment of DEGs between control siRNA and CTGF siRNA groups is presented; darker colors indicate lower p-values. (C) Three significant enrichment plots of pathway enrichment analysis of DEGs using GSEA. GSEA-based KEGG analysis-enrichment plots of representative gene sets: ECM–receptor interactions, cell adhesion molecules, and focal adhesion. The green line represents the enrichment profile. (D) For selective migration assay, a transwell assay was performed. The negative control siRNA or CTGF siRNA-transfected cells were seeded on the inner chamber. After fixing, cells were visualized by crystal violet staining. Unmigrated cells were scraped off, and the migrated cells were counted under a light microscope. (E) Cells were scratched with a micropipette tip to form a cell-free (wounded) area and were transfected with siCTGF. Wound areas are visualized using a phase-contrast microscope. The distance migrated was determined as the average of the distances of each cell from the wound boundary. The results are representative of three independent experiments. The data are expressed as means ± SD. *** p < 0.005.

