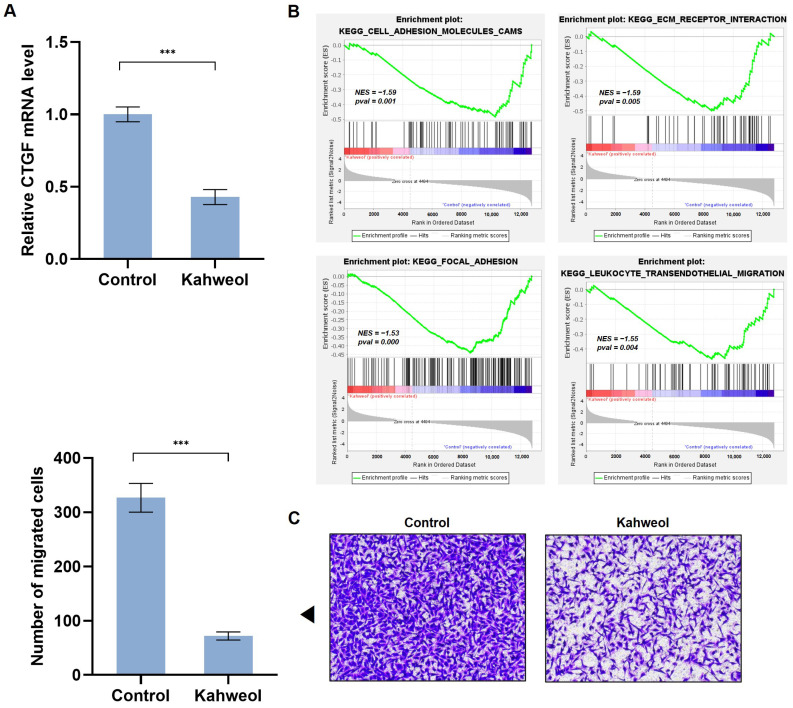
Figure 3.
Anti-migratory effect of kahweol in MDA-MB 231 cells. MDA-MB 231 cells were treated with kahweol (50 µM) for 48 h. (A) mRNA level of CTGF was determined by qRT-PCR analysis. (B) Four significant enrichment plots of the pathway enrichment analysis of DEGs using GSEA. GSEA-based KEGG analysis-enrichment plots of representative gene sets: cell adhesion molecules, ECM–receptor interactions, focal adhesion, and leukocyte transendothelial migration. The green line represents the enrichment profile. (C) For the selective migration assay, a transwell assay was performed. Kahweol-treated cells were seeded on the inner chamber for 48 h. After fixing, cells were visualized by crystal violet staining. Unmigrated cells were scraped off, and the migrated cells were counted under a light microscope. The arrow indicates statistical graphs illustrating the results of the transwell analysis. Results are representative of three independent experiments. Data are expressed as means ± SD. *** p < 0.005.

