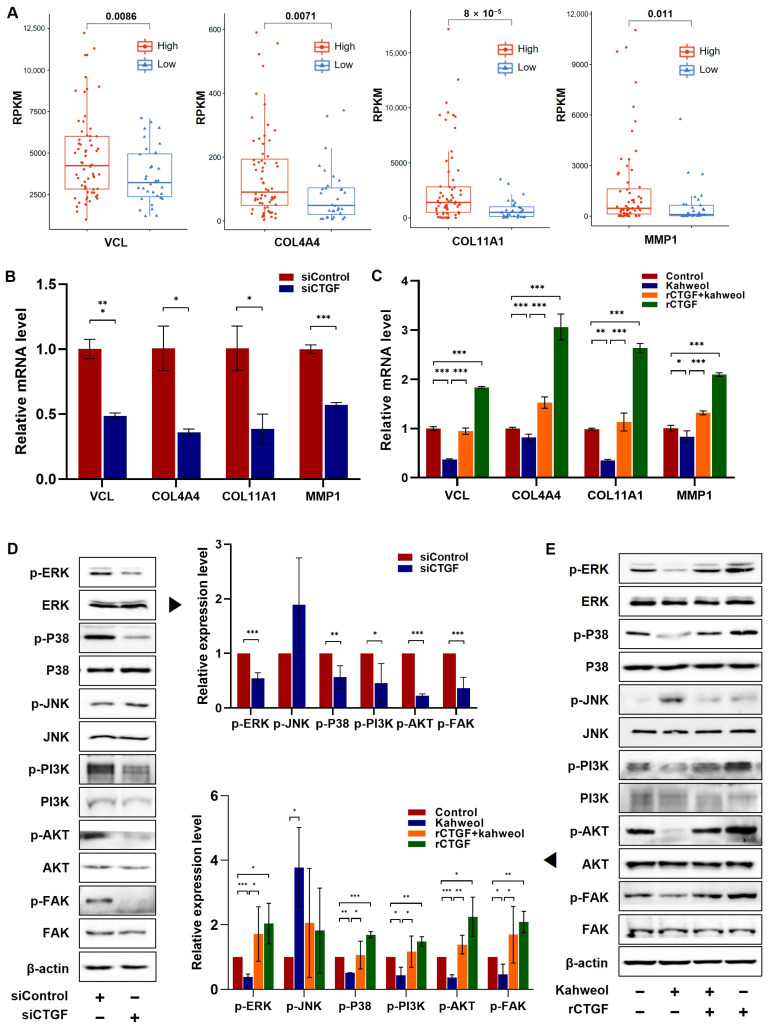
Figure 5.
The involvement of MAPKs, PI3K/AKT, and FAK in the mechanisms underlying the kahweol effect on MDA-MB 231 cells’ motility. (A) The genes were selected from migration-related pathways in the RNA-seq results of clinical patient data and were plotted. (B,D) Cells were transfected with 100 nM siRNA specific for the CTGF gene or control siRNA. (C,E) Cells were pretreated with rCTGF (400 ng/mL) and kahweol (50 µM) at one-hour intervals for 24 h. (B,C) The mRNA levels of VCL, COL4A4, COL11A1, and MMP1 were determined by qRT-PCR analysis. Results are representative of three independent experiments. (D,E) Protein levels of phosphorylated MAPKs, PI3K/AKT, and FAK were determined by Western blotting with specific antibodies. The arrow indicates statistical graphs illustrating the results of the Western blot analysis, respectively. Bar graphs present the densitometric quantification of the Western blot bands. Data are expressed as means ± SD. * p < 0.05, ** p < 0.01, *** p < 0.005.

