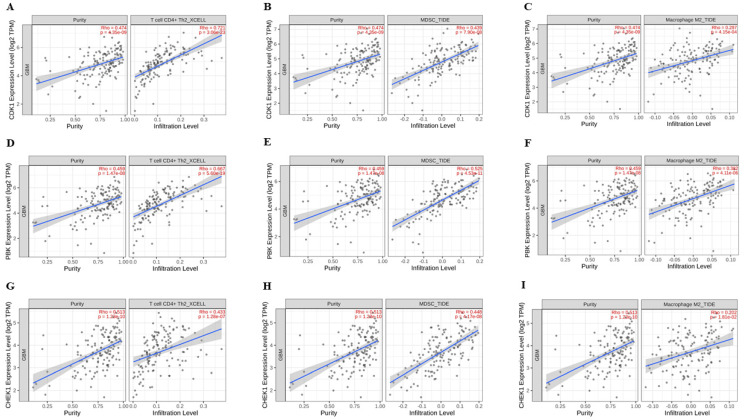
Figure 5.
CDK1/PBK/CHEK1 overexpression promotes tumor aggressiveness and immunosuppression in GBM. (A–C) depict a moderate positive correlation of CDK1 expression levels with tumor purity (Rho = 0.474) and a strong, moderate, and weak positive correlation with T Cells CD4+ Th2 (Rho = 0.721), MDSCs (Rho = 0.439), and TAM-M2 (Rho = 0.297) infiltration levels in GBM, analyzed on TIMER2.0. (D–F) show a moderate positive correlation of PBK expression level with GBM tumor purity (Rho = 0.459), as well as a strong, moderate, and weak positive correlation with T Cells CD4+ Th2 (Rho = 0.667), MDSCs (Rho = 0.525), and TAM-M2 (Rho = 0.382) infiltration levels. (G–I) show a moderate positive correlation of CHEK1 expression levels with tumor purity (Rho = 0.513), T Cells CD4+ Th2 (Rho = 0.433), and MDSCs (Rho = 0.448), and a weak positive correlation with TAM-M2 (Rho = 0.202) infiltration levels in GBM. CDK1/PBK/CHEK1 mRNA expression levels are expressed as TPM and were normalized and transformed using log2 transformation with a p-value < 0.05.

