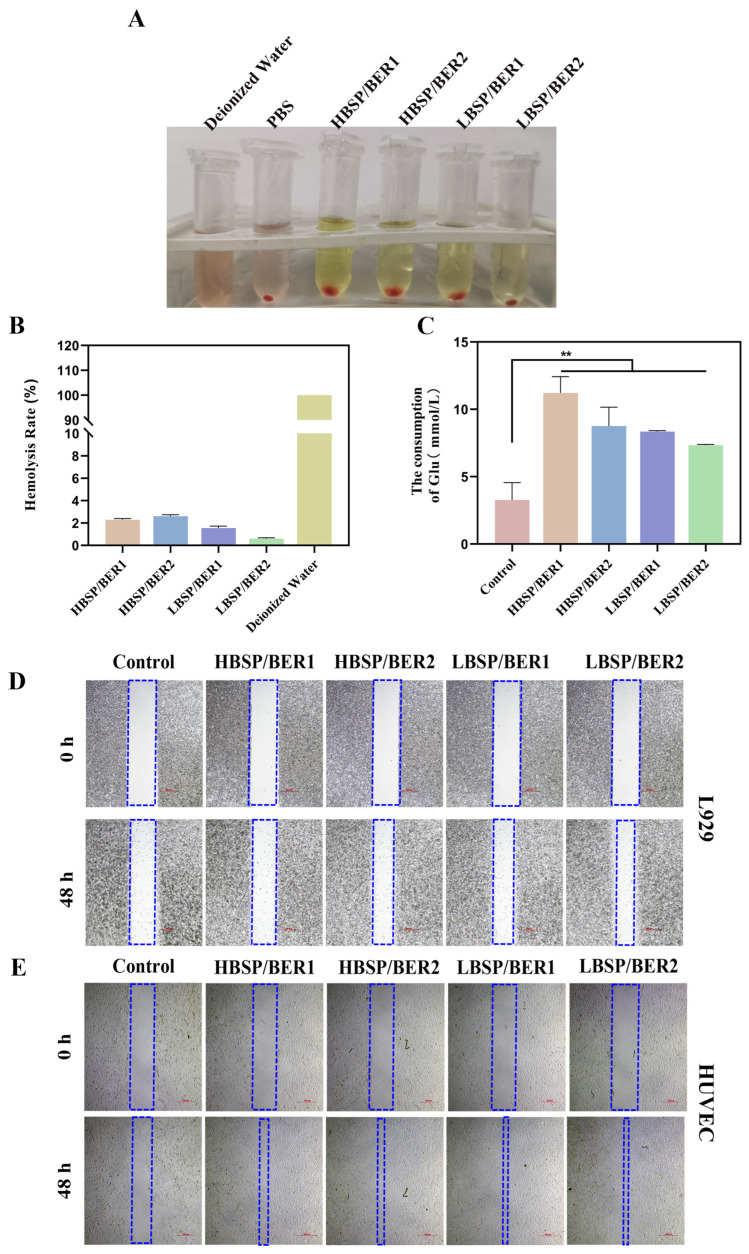
Figure 3.
Hemolytic photographs (A) and ratio (B). (C) Effect of hydrogel on glucose consumption of L929 cells. L929 cell (D) and HUVEC cell (E) migration. The blue frame: schematic diagram of the middle free area of cell, scar bar: 500 μm. Data presented as mean ± SD, n = 3. Statistically significant: ** p < 0.01.

