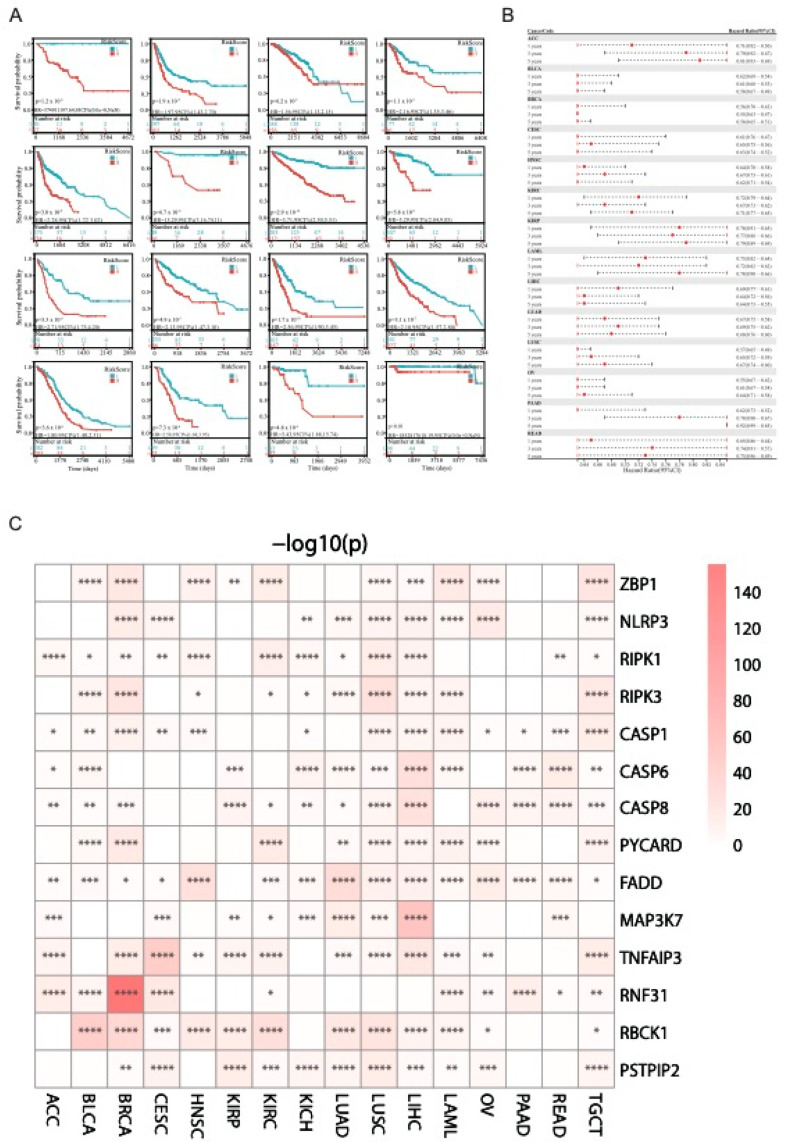
Figure 8.
Patient survival analysis. (A) In different cancers, patients were divided into high and low risk score groups, and the survival differences between the two groups were compared. (B) Prediction of the incidence rate of different cancers after 1, 3, and 5 years. (C) The relationship between PANRGs and survival rates of various cancer patients. (*: p < 0.05, **: p < 0.01, ***: p < 0.001, ****: p < 0.0001).

